Want to See Where Transit and Biking Need a Boost? D.C. Has a Map for That
Most places in the U.S. still use 20th century metrics to assess the performance of transportation systems. The emphasis is still on moving cars and reducing motorist delay, not, say, improving transit service or making bicycling less stressful.
With the release of a new data portal, the District Department of Transportation is letting people assess streets and transit in DC according to a different set of priorities. DDOT’s metrics include some traditional measures of vehicle congestion, but they are framed within the context of the larger transportation system. The full picture that emerges shows how city streets are performing for transit, biking, and walking as well.
Nicole Cacozza at Greater Greater Washington pulled out these insights from the analysis of bus performance:
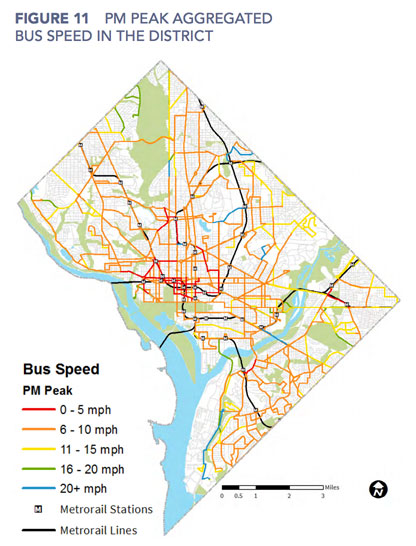
According to the street congestion metrics, the slowest stretch of road in the entire city is K Street at rush hour. Buses there have it especially bad, averaging just 3.5 mph, barely beating walking speed. Most of the worst travel times in the city are on east-west roads downtown, and in Columbia Heights. The average bus speed almost anywhere in the city is 10 miles per hour or slower during rush hour, and only 5 mph downtown.
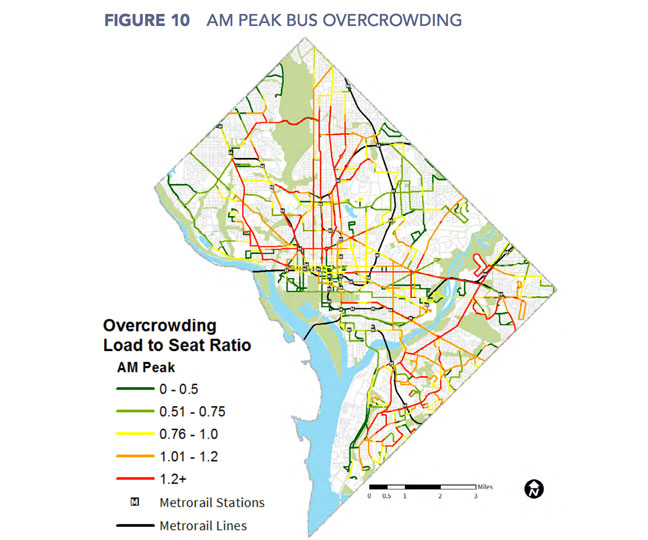
It’s not only outside the bus that is congested. Inside is too. Most of the city’s bus lines are stuffed with riders. WMATA officially designates overcrowding at 120% of seated capacity, which is an uncomfortable ride for all passengers. In the morning rush, 40 different bus lines in the city meet that overcrowding standard. On the S line, which has one express and three full service routes, at least one route is overcrowded at all times.’Of course, not all the buses are on time. The portal tells us where on time performance is good, and where it’s bad. The 90 north from U Street to Calvert Street NW is the latest bus in the city, averaging six minutes late. Meanwhile, the W5 west at Anacostia station and the V5 north at H St SE both routinely arrive seven minutes early, confounding riders who rely on the schedule.
You can see more maps at the data portal and explore more detail in the agency’s performance report [PDF].
More recommended reading today: More than 40,000 people were killed on American streets in 2016, and the National Association of City Transportation Officials says safer street design is the solution. And Bike Pittsburgh announces that a local library will soon begin lending out bike tools.

Read More:
Streetsblog has migrated to a new comment system. New commenters can register directly in the comments section of any article. Returning commenters: your previous comments and display name have been preserved, but you'll need to reclaim your account by clicking "Forgot your password?" on the sign-in form, entering your email, and following the verification link to set a new password — this is required because passwords could not be carried over during the migration. For questions, contact tips@streetsblog.org.