Sunbelt Cities Rank Last in National Street Safety Index
The streets of Sunbelt cities continue to endanger pedestrians, cyclists, and car drivers, even as many American metropolitan areas are making real progress on road safety.
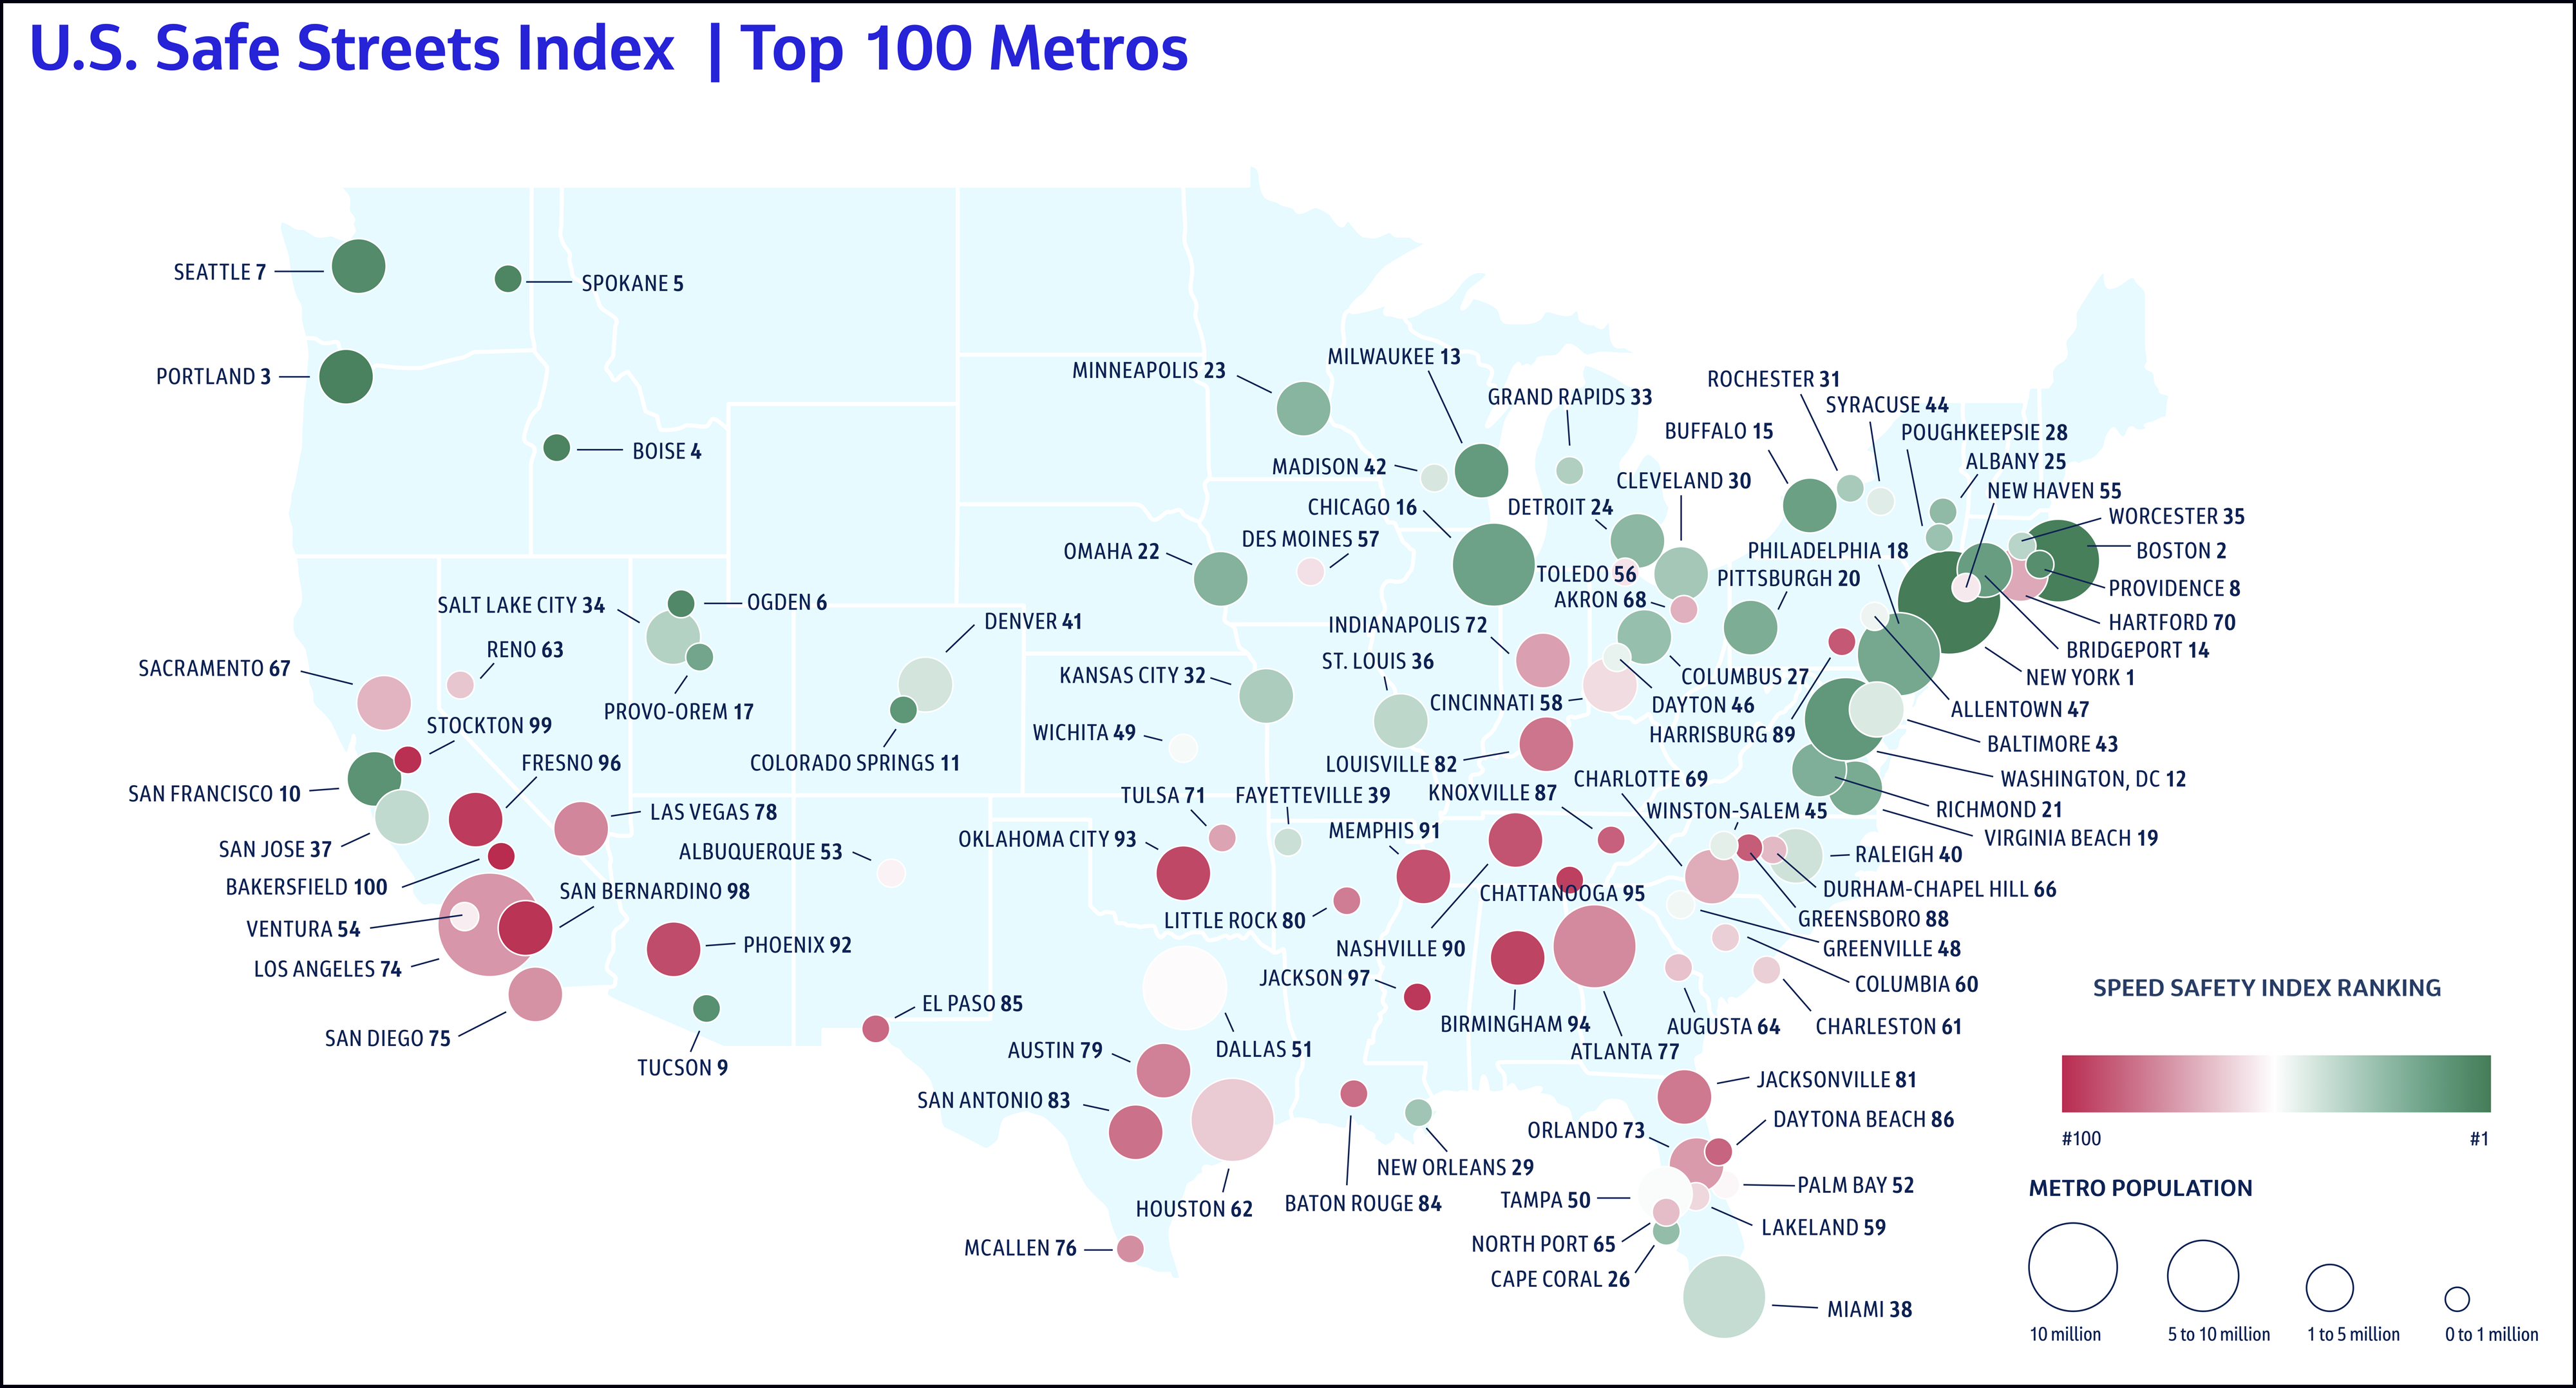
That’s one of the main takeaways of the new U.S. Safe Streets Index published by the transportation analytics firm StreetLight, which ranked the 100 biggest metros according to several key safety metrics.
New York City came in first and Bakersfield, California came in last — and towards the bottom of that range are a lot of southern cities.
StreetLight’s analysis reveals a dramatic contrast between coastal and northern cities and nearly all of the Sunbelt because of several challenges identified by the firm, not the least of which is how much driving is done in car-centric cities.
“Vehicle miles traveled exposure tends to be high, and there is also heavy speed risk on pedestrian heavy roadways, which may be linked to wider arterials and higher-speed corridors,” Martin Morzynski of StreetLight told Streetsblog.
Apart from a handful of exceptions, like Tucson and Indianapolis, the map’s stark pattern also tracks the relative ages of the anchor cities. Most of the safest metros developed before the invention of the automobile in 1885, while nearly all of the more dangerous metros developed after it. The interlocking policies of suburban sprawl and car-centric street design turned Sunbelt cities into pedestrian thunderdomes.
Streetlight based its rankings on five “safety factors”:
- The aforementioned VMT
- Speed differential, which describes “the difference between 15th and 85th percentile speeds on non-residential roads”
- Pedestrian risk, which tabulates “the share of pedestrian miles traveled on roadways with a high volume of cars and average speeds of 30 mph or higher”
- Residential speeding, which refers to “the percentage of vehicles traveling at least 5 mph above the speed limit on residential roads”
- Truck activity, which is the percentage of VMT conducted by trucks
StreetLight’s index highlights the success of Boston and New York City, and emphasizes that “larger metros tend to perform better overall for roadway safety, despite popular misconceptions that big cities are more dangerous.”
But what explains the vivid contrast between Sunbelt metros and their colder, coastal counterparts?
“Northern coastal metros may perform better in the Safe Streets Index due to their density and transit-oriented infrastructure, which helps limit miles driven, the highest-weighted factor in the analysis,” said Morzynski. “Metros like New York and San Francisco rank especially well for reducing overall crash risk simply by lowering driving exposure. In contrast, many Sun Belt metros have more auto-oriented networks, higher-speed arterials, and greater pedestrian [risk].”
The report encourages transportation planners to assess the granular data for specific metros — and steal great ideas from the safest cities.
“Portland, Oregon ranks as one of the strongest performers for roadway safety overall, based on our metrics,” the reports says. “But when we look at the metro’s scores on individual metrics, we can see that its biggest areas for potential improvement are speeds on pedestrian-heavy roads, where Portland ranks in the middle of the pack, as well as truck activity per capita, where it falls outside the top third.”
There are some noteworthy discrepancies, too. Streetlight ranked Los Angeles 96th out of 100 in terms of speed differential risk. But it also ranked L.A. fifth out of 100 for residential speeds. The second-biggest metro in the United States ultimately received an overall rank of 75th out of 100.

Read More:
Streetsblog has migrated to a new comment system. New commenters can register directly in the comments section of any article. Returning commenters: your previous comments and display name have been preserved, but you'll need to reclaim your account by clicking "Forgot your password?" on the sign-in form, entering your email, and following the verification link to set a new password — this is required because passwords could not be carried over during the migration. For questions, contact tips@streetsblog.org.