The Most Dangerous Roads in America for Walkers
Three quarters of the most fatal roads in America for pedestrians are located in low-income neighborhoods, a new study finds — and those roads share a handful of notoriously dangerous design features that can and must be fixed.
In what may be the only attempt to map the U.S. corridors with the highest numbers of pedestrian deaths ever conducted, researchers analyzed data on every pedestrian crash fatality since the federal government began collecting standardized data on them in 2001, until 2016, the last year for which finalized data is available.
After studying more than 62,000 incidents across 16 years, the researchers generated a list of more than 60 “hot spot” corridors where at least six walkers had lost their lives along a specific, 1,000-meter stretch of road in eight years or less. (Crashes on interstate freeways where walkers are banned and a handful which were lacking geocoded location information were excluded.)
The surprisingly varied list spans communities from pedestrian-rich Northeastern megacities to car-dependent Sun Belt towns that routinely rank among the most dangerous for pedestrians. Notorious roads like U.S. Highway 19 in Pasco County, FL, made the list – the 20-mile corridor was the site of seven distinct hot spots and 137 walking fatalities during the study period, almost the same number of U.S. commercial airline deaths during the same years — but so did 12 corridors in New York City, which often ranks as the most walkable city in America. (You can find out whether there’s a hot spot in your community in Appendix B on this page.)
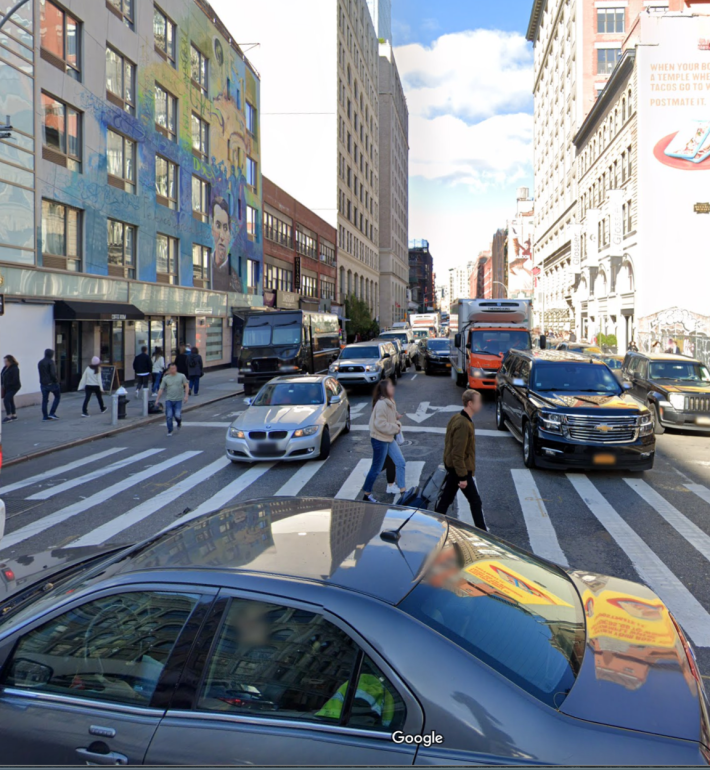
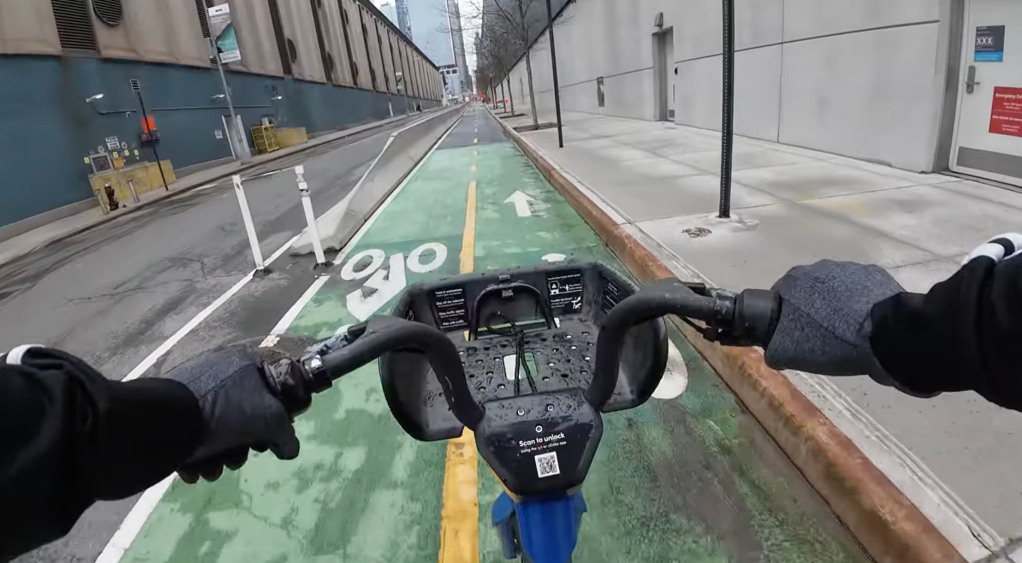
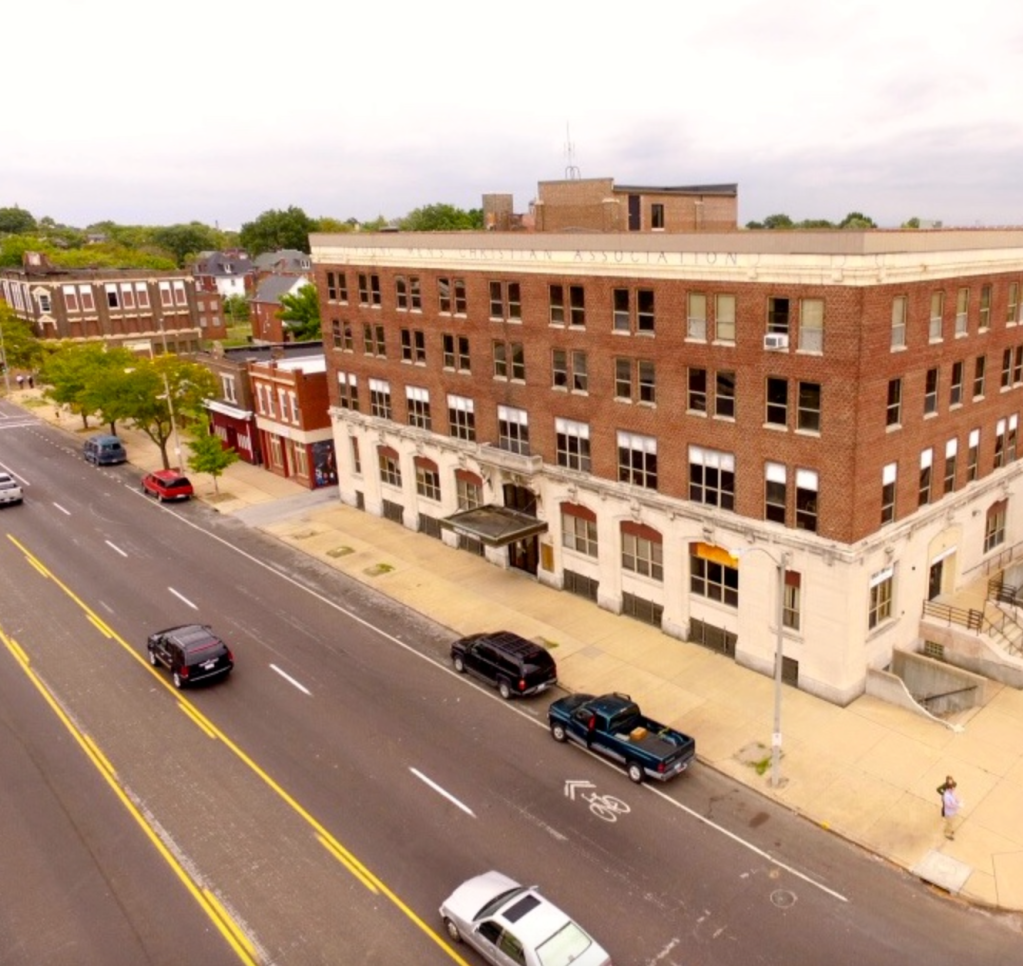
No matter the location, the design of the deadly roads were much the same: ultra-wide, blisteringly fast, and flanked by businesses to which residents walk every day.
Although not all are technically classified as arterials or regional highways, most of them sure look like it. A staggering 97 percent of the hotspots had three lanes or more, and 70 percent forced walkers to cross at least five lanes in order to reach the other side. More than 75 percent had speed limits of over 30 miles per hour — a speed at which 40 percent of walkers will die when struck by a vehicle — and 100 percent of them were flanked by retail, grocery, or other essential services.
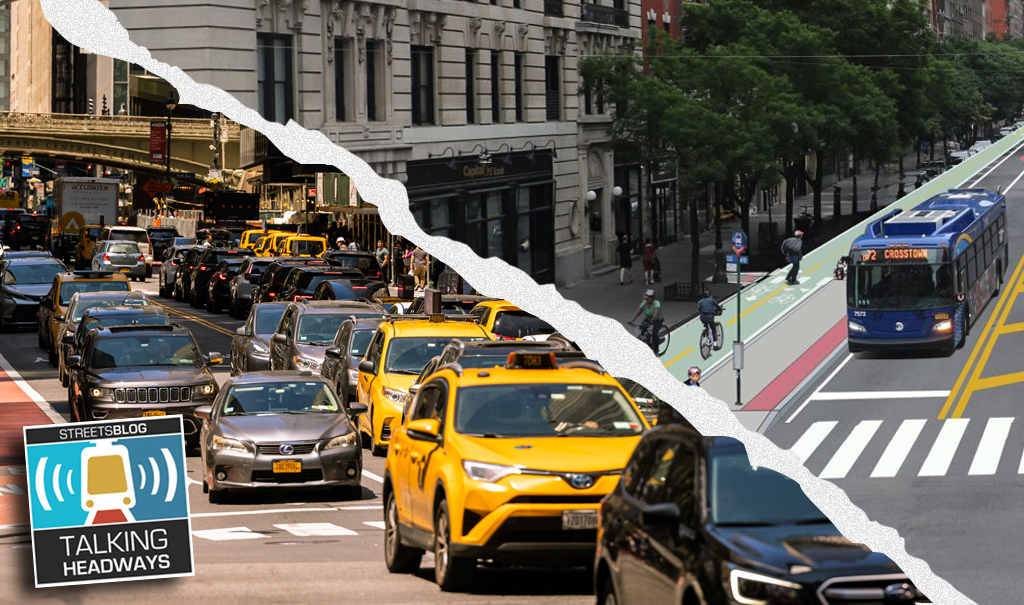
That won’t surprise street-safety advocates who appreciate the outsized impact road design has on walking safety, but it’s not reflected in much of American transportation policy and design guidelines, which often advise planners to run wide, fast roads into the heart of city neighborhoods in the name of “level of service” for drivers. And when communities do attempt to mitigate crashes, they tend to over-focus on education and enforcement for individual road users, rather than rethinking the conditions that make crashes more likely, experts say.
“For a long time, the transportation-safety profession has focused on how individual behaviors contribute to car crashes, and regarded where they happen as sort of random,” said Robert J. Schneider, an associate professor at University of Wisconsin-Milwaukee and the co-author of the study. “But at a systems level, it’s not random. We actually know the context in which these crashes occur, because we’ve seen it — over and over and over again.”
But while the dangers of highway-style road design in city neighborhoods might seem obvious to anyone who’s ever tried to cross a stroad, most U.S. communities don’t even map their worst crashes, much less ask which common designs might be propelling the death toll. Some advocates think they should be required to do so — and given the resources they need to do it right.
“This type of analysis does take special skills and access to good data, and that takes resources,” said Rebecca L. Sanders, the founder and principal researcher of Safe Streets Research, LLC, and Schneider’s co-author. “A lot of cities don’t even have good geo-data on the number of lanes on their roads or the speed limits on those roads, much less people to analyze [trends in crash-location characteristics.] NHTSA has people with the skills to get that data and do that analysis, or they should be able to hire people with these skills. The fact that they don’t speaks to the larger funding priorities and what they support — because year after year, we underfund bicycle and pedestrian safety, pretty much at every level.”
The task wasn’t easy for Sanders and her colleagues, despite the fact that cities often hire her firm to identify and make recommendations on improving their most dangerous roads. She and her co-authors painstakingly scrutinized the design and land-use characteristics of each hot spot on Google Street View, which, they say, limited the number of dangerous corridors they could evaluate. If the threshold for a “hot spot” had been set at five deaths in eight years instead of six, Schneider says the study would have taken “hundreds of additional hours” to complete; he hopes other researchers will study their own municipalities in more granular detail.
“And we’re not even talking about serious injuries, or mild injuries — all these things that can completely change your life, especially if you’re low income,” Sanders adds. “Even before you talk about deaths, you have to ask yourself: What are we doing creating these routes that are this hellish for people?”
Of course, Schneider and Sanders acknowledge that road design isn’t the only factor involved in our pedestrian death crisis, and that their study simply can’t correct for certain variables, such as changing walking rates, drunk-driving rates, and design interventions that might have been undertaken during the study period, all of which might change a hot spot’s death totals over time. Only five of the 60 hot spots identified in the paper had more than six walking deaths in both the first and second half of the study period; New York City, for example, saw its total number of hot spots fall by 32 percent from the first eight year span to the second, which could indicate that the Big Apple has been making progress on curbing the carnage, or that other factors were at play.
But both researchers stress that the ubiquity of bad road design in America’s most deadly corridors should be cause enough for communities to take a hard look at their road networks and start thinking about how they can fix their deadliest features.
“You can ask yourself right now: Where is there a road in my community that is four or more lanes, is signed at 30 miles per hour or above, and has a lot of destinations for pedestrians, like retail and services?” said Schneider. “You don’t need to wait until it’s a hot spot. You can put all those pieces together and say, ‘Let’s make some changes.'”

Read More:
Streetsblog has migrated to a new comment system. New commenters can register directly in the comments section of any article. Returning commenters: your previous comments and display name have been preserved, but you'll need to reclaim your account by clicking "Forgot your password?" on the sign-in form, entering your email, and following the verification link to set a new password — this is required because passwords could not be carried over during the migration. For questions, contact tips@streetsblog.org.