We’re driven to extraction.
Many Americans have embraced remote work culture, but the work-from-home ethos didn’t cause an expected decrease in driving and congestion. In fact, data show an increase in total vehicle miles traveled, a new analysis reveals.
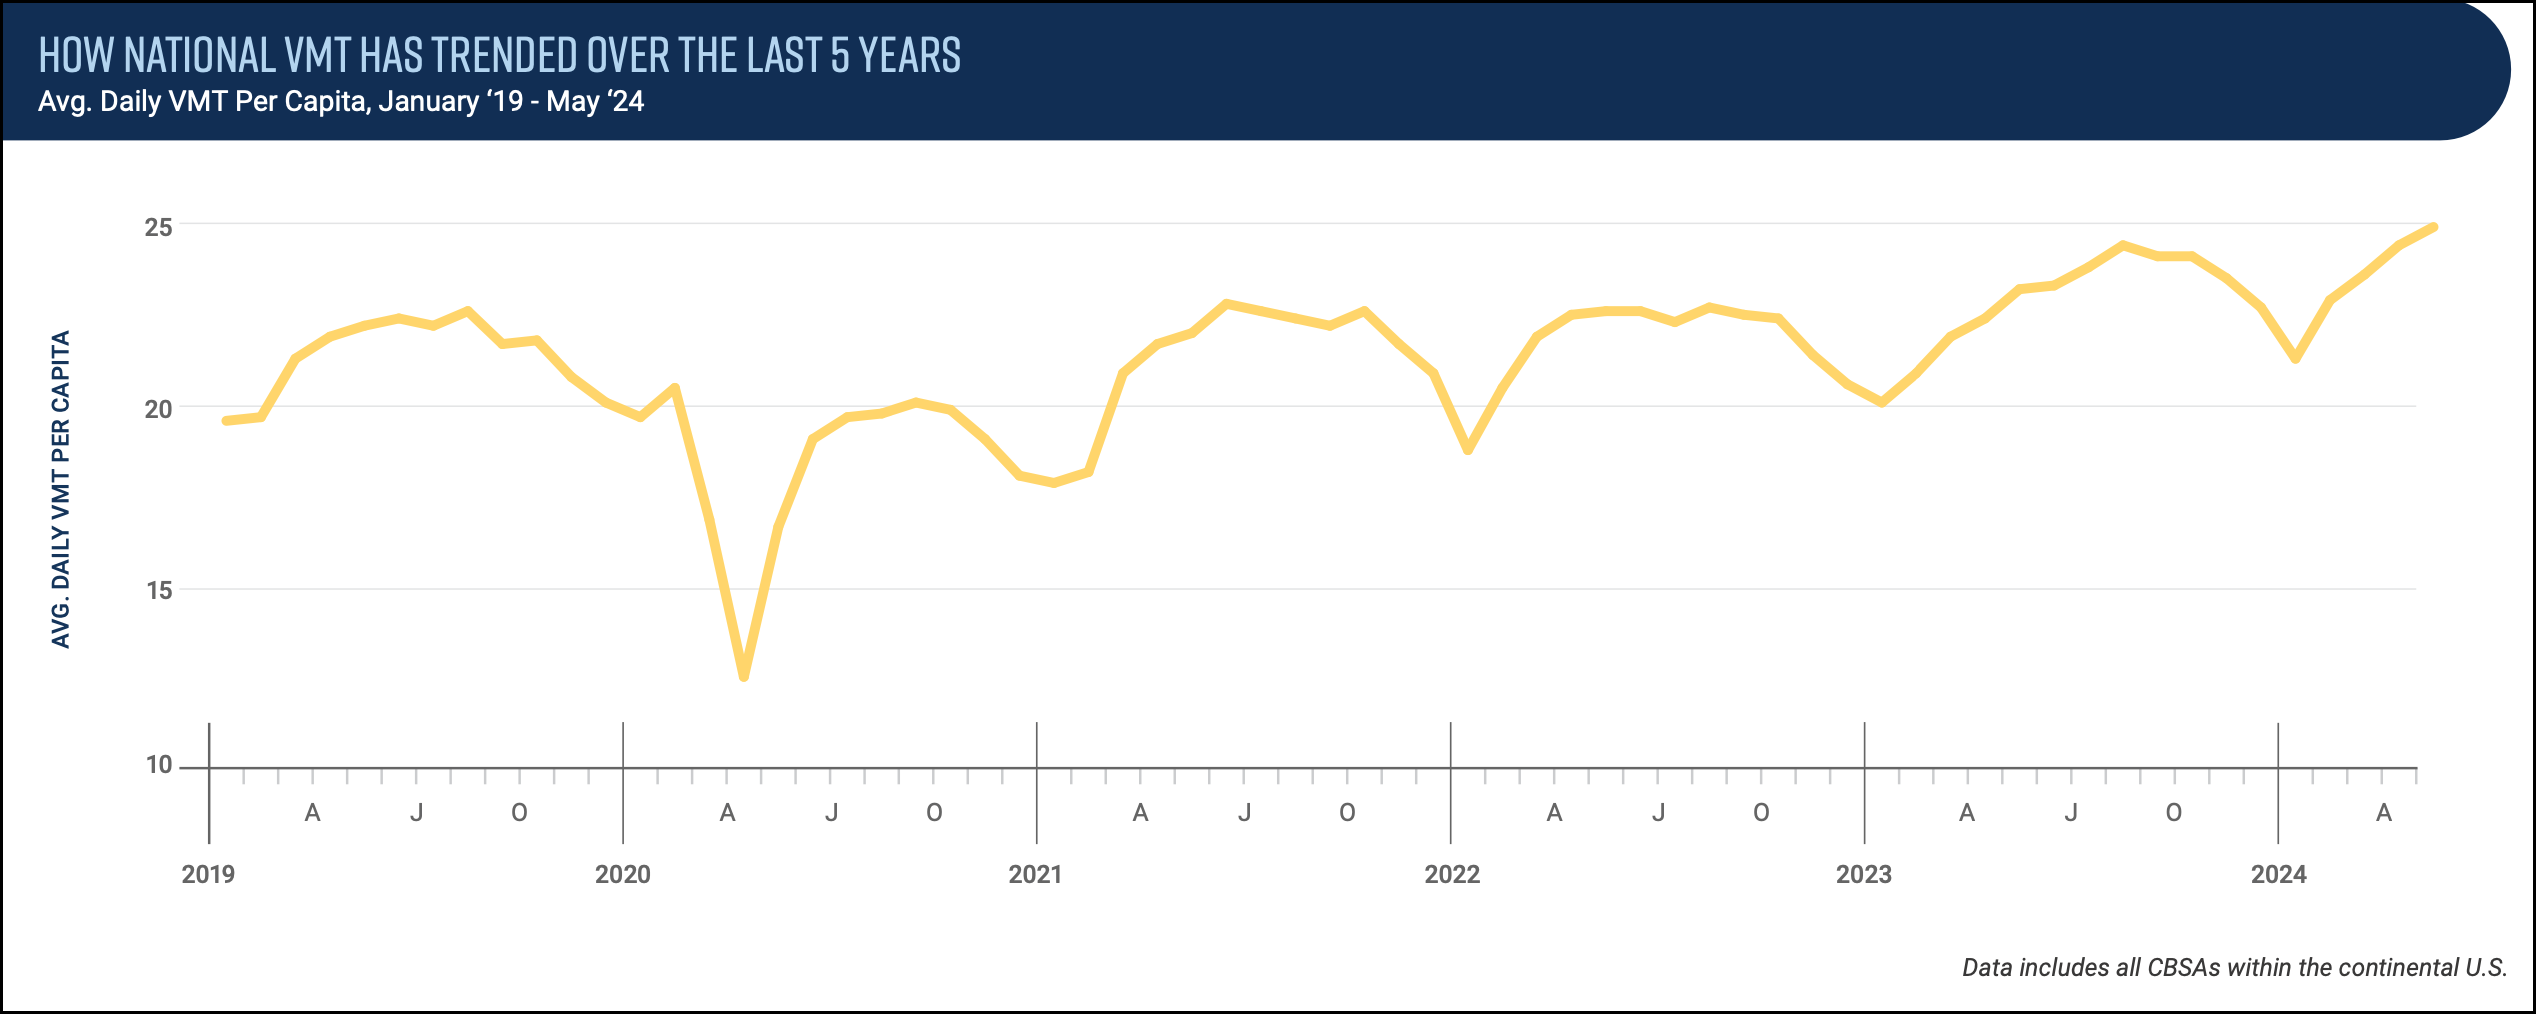
According to Streetlight Data, a mobility analytics firm, VMTs per capita jumped 12 percent between May 2019 and May 2024 — an indication that individuals are simply doing more driving which is causing more reliance on fossil fuels. And 88 of the nation’s 100 most populated metro areas experienced a total increase in vehicle miles over the same period.
Over that five-year period, vehicle miles traveled increased in expected places — metro area El Paso (up 42 percent), Boise City (up 58 percent) and McAllen-Edinburg-Mission, Texas (up 68 percent) — but also in unexpected metros, such as transit-friendly Chicago (up 5 percent) and Philadelphia (up 6 percent).
And only two metropolitan areas out of 100 had less congestion in spring 2024 compared to spring 2019. Those two, San Franciscio and Albuquerque, only reduced congestion by less than half a percentage point (0.4 percent and 0.3 percent, respectively.)
Oddly, even as the pandemic receded, the jump in VMTs was most pronounced between January and May, compared to the same period last previous year. That increase marks the steepest year-over-year increase since the initial pandemic bounce back in 2021, Streetlight reported.
“Overwhelmingly, VMT accelerated in the last year, as compared to 2022-2023,” the report stated. “This is a flashing red light to localities. Without significant changes, the upward trend in VMT shows no signs of peaking.”
Overall, since January 2023, per capital VMTs nationwide are up 20 percent.
Researchers also looked at the connection between congestion and VMT in the top 25 metro cities and their downtowns during that period.
Only one metro area — as above, San Francisco — lowered congestion during the period. The key there: the Frisco metro area also had roughly 14 percent fewer VMT. Meanwhile, every other metro area experienced more congestion — some drastically.
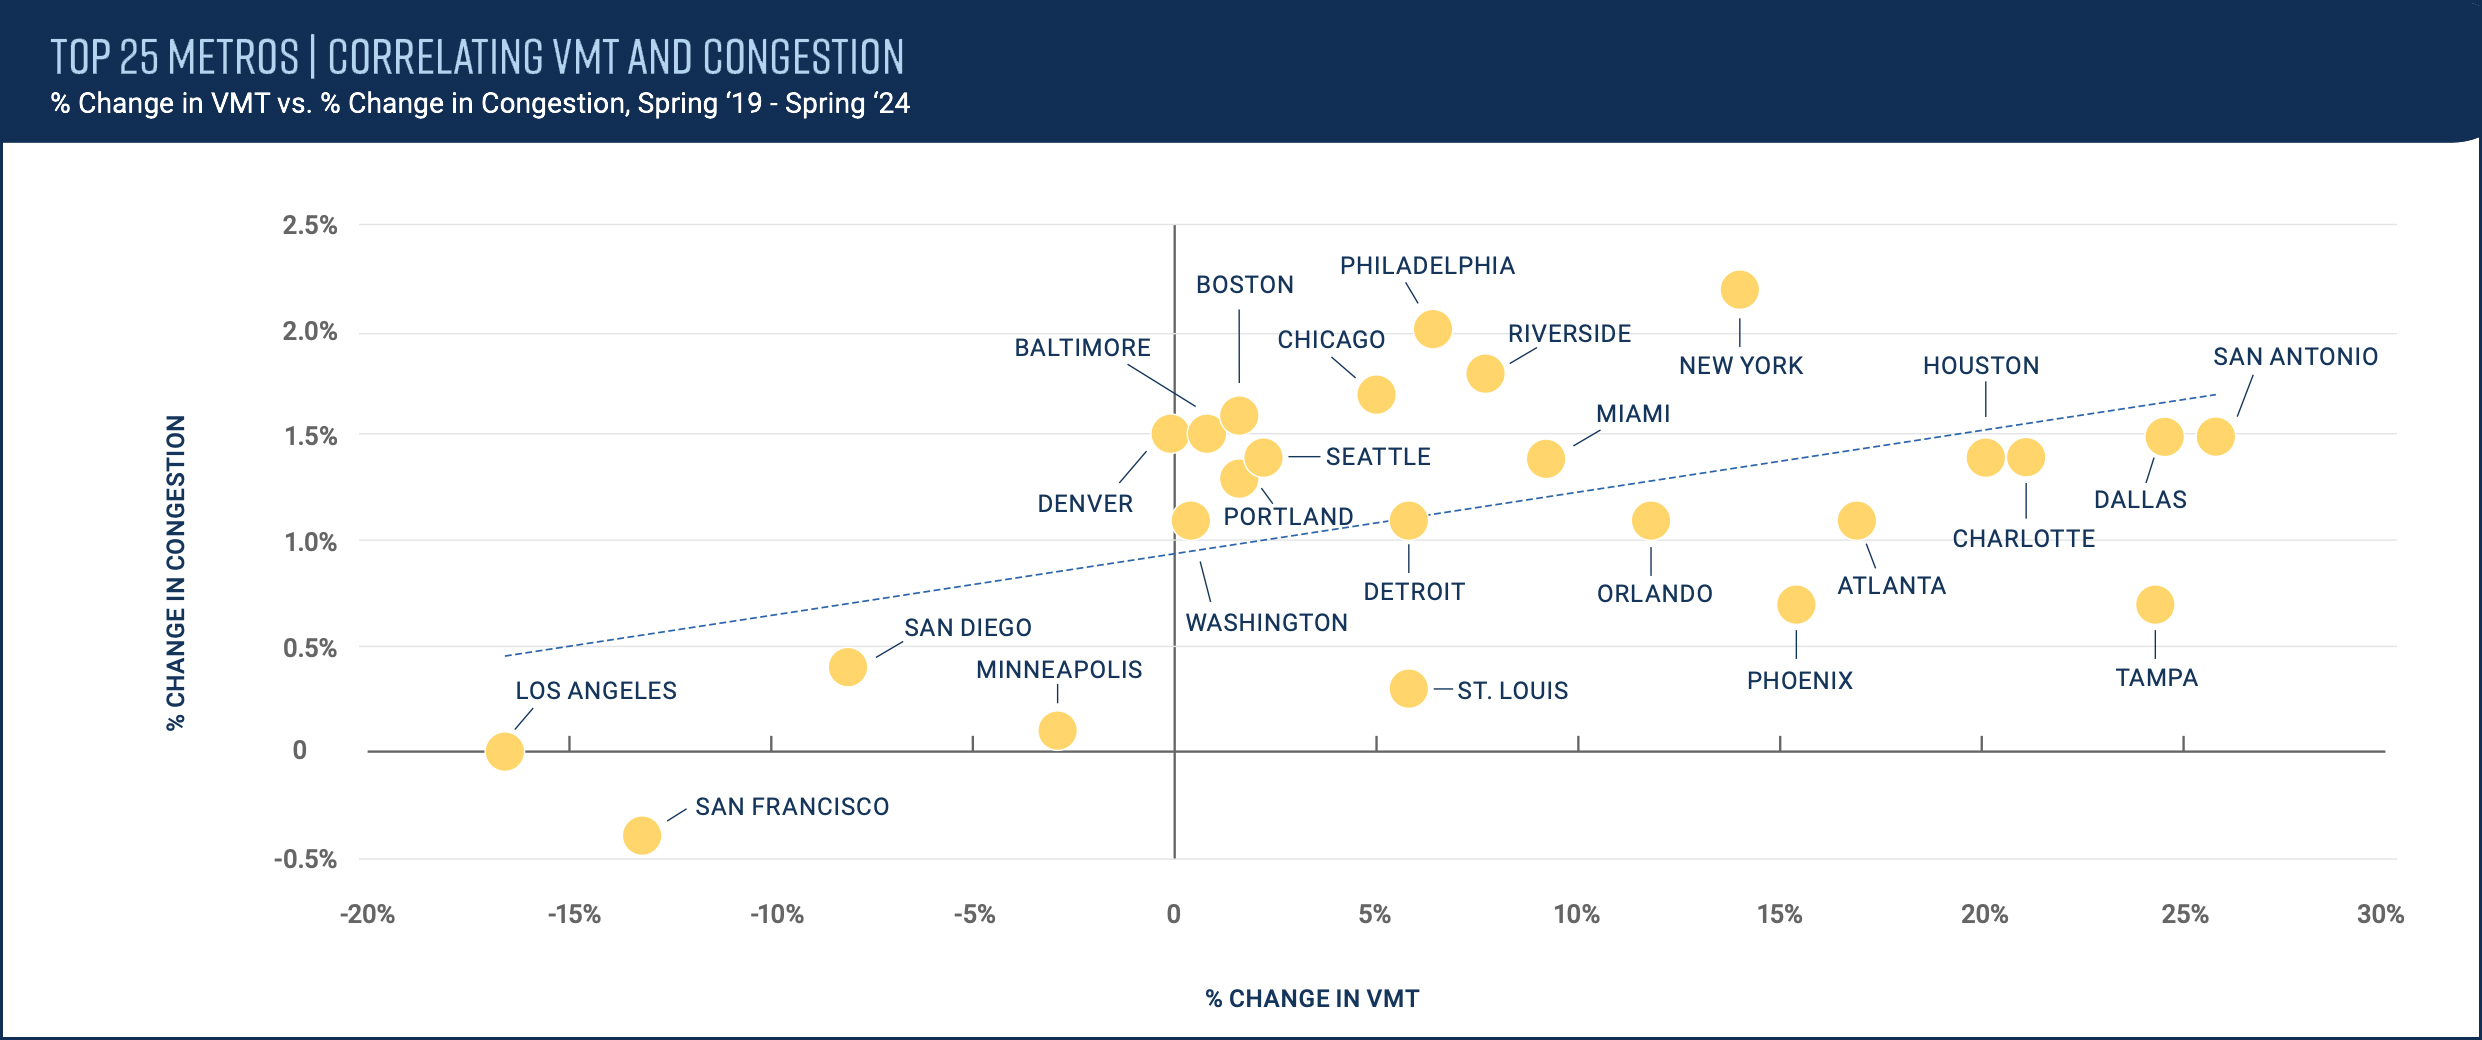
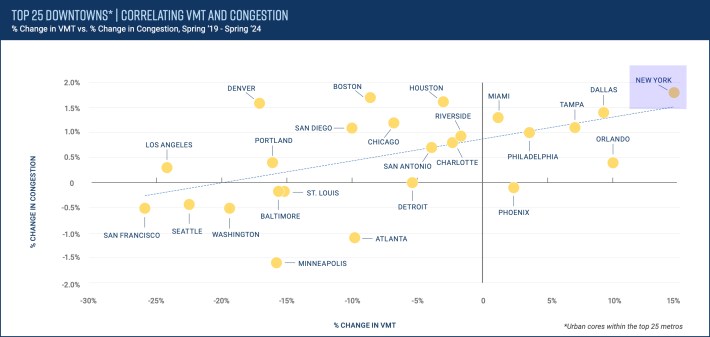
The New York City metro area held the dubious distinction of having among the biggest surge in per-capita VMT — just under 15 percent — and the highest uptick in congestion (roughly 2.2 percent) in the past 5 years (see sidebar). The increase in traffic in the city’s downtown core was the worst in the country:
That increase frustrated advocates because the numbers might have been expected to trend downward if Gov. Kathy Hochul had not abruptly canceled a congestion pricing plan that was slated to start on June 30. Advocates seized on the Streetlight report as evidence of political malpractice.
“These new findings make it crystal clear that our elected officials have a lot of work to do when it comes to reducing driving,” said Sara Lind, co-executive director of Open Plans, a livable streets advocacy group in New York City (and, full disclosure, a sister organization to Streetsblog). “It’s obvious that the increase in gridlock that we all bemoan is a direct result of this dramatic rise in driving — not bike lanes or outdoor dining or other street improvements.”
Why this data matters
The Covid pandemic that began in 2020 killed more than 1.2 million people. Behind that grim statistic was a glimmer of hope: as more people embraced remote work it seemed possible that fewer people would be driving, which, in turn, would reduce greenhouse gas emissions, lost productivity due to congestion and road violence. But after a brief lull, the number of traffic deaths skyrocketed during the pandemic. The reasons for this are varied and complicated, but the rise in traffic deaths and a return to unprecedented driving and ensuing congestion didn’t help the country’s larger environmental hurdles.
The U.S. pledged to cut greenhouse gas emissions by 50 percent by 2030. But the transportation sector — which is now the largest contributor to the nation’s planet-warming emissions, is going in the wrong direction. The surge of remote work, and other changes to the labor culture not only didn’t slow driving, but increased it. And that shocked researchers.
“We’ve settled into people going back to the office, so looking at five years of data, we would expect to see an uptick [in VMT],” said Emily Adler, content director with Streetlight. “But I anticipated a little bit of a flat line. What was stark to me was to see that acceleration.
“Congestion is just really persistent,” Adler said, and while there was a positive correlation between VMT change and congestion change it’s going to take a lot of VMT reduction to really get that congestion reduction,” she added.
The numbers may be horrific, there is power in knowing the work that needs to be done.
“The purpose of this data is to really give policymakers, advocates, transportation planners a benchmark,” Adler said. “Without this data, we don’t know where we are [or] where we’ve been, so we can’t determine where we’re going and how we can reach those goals.”
