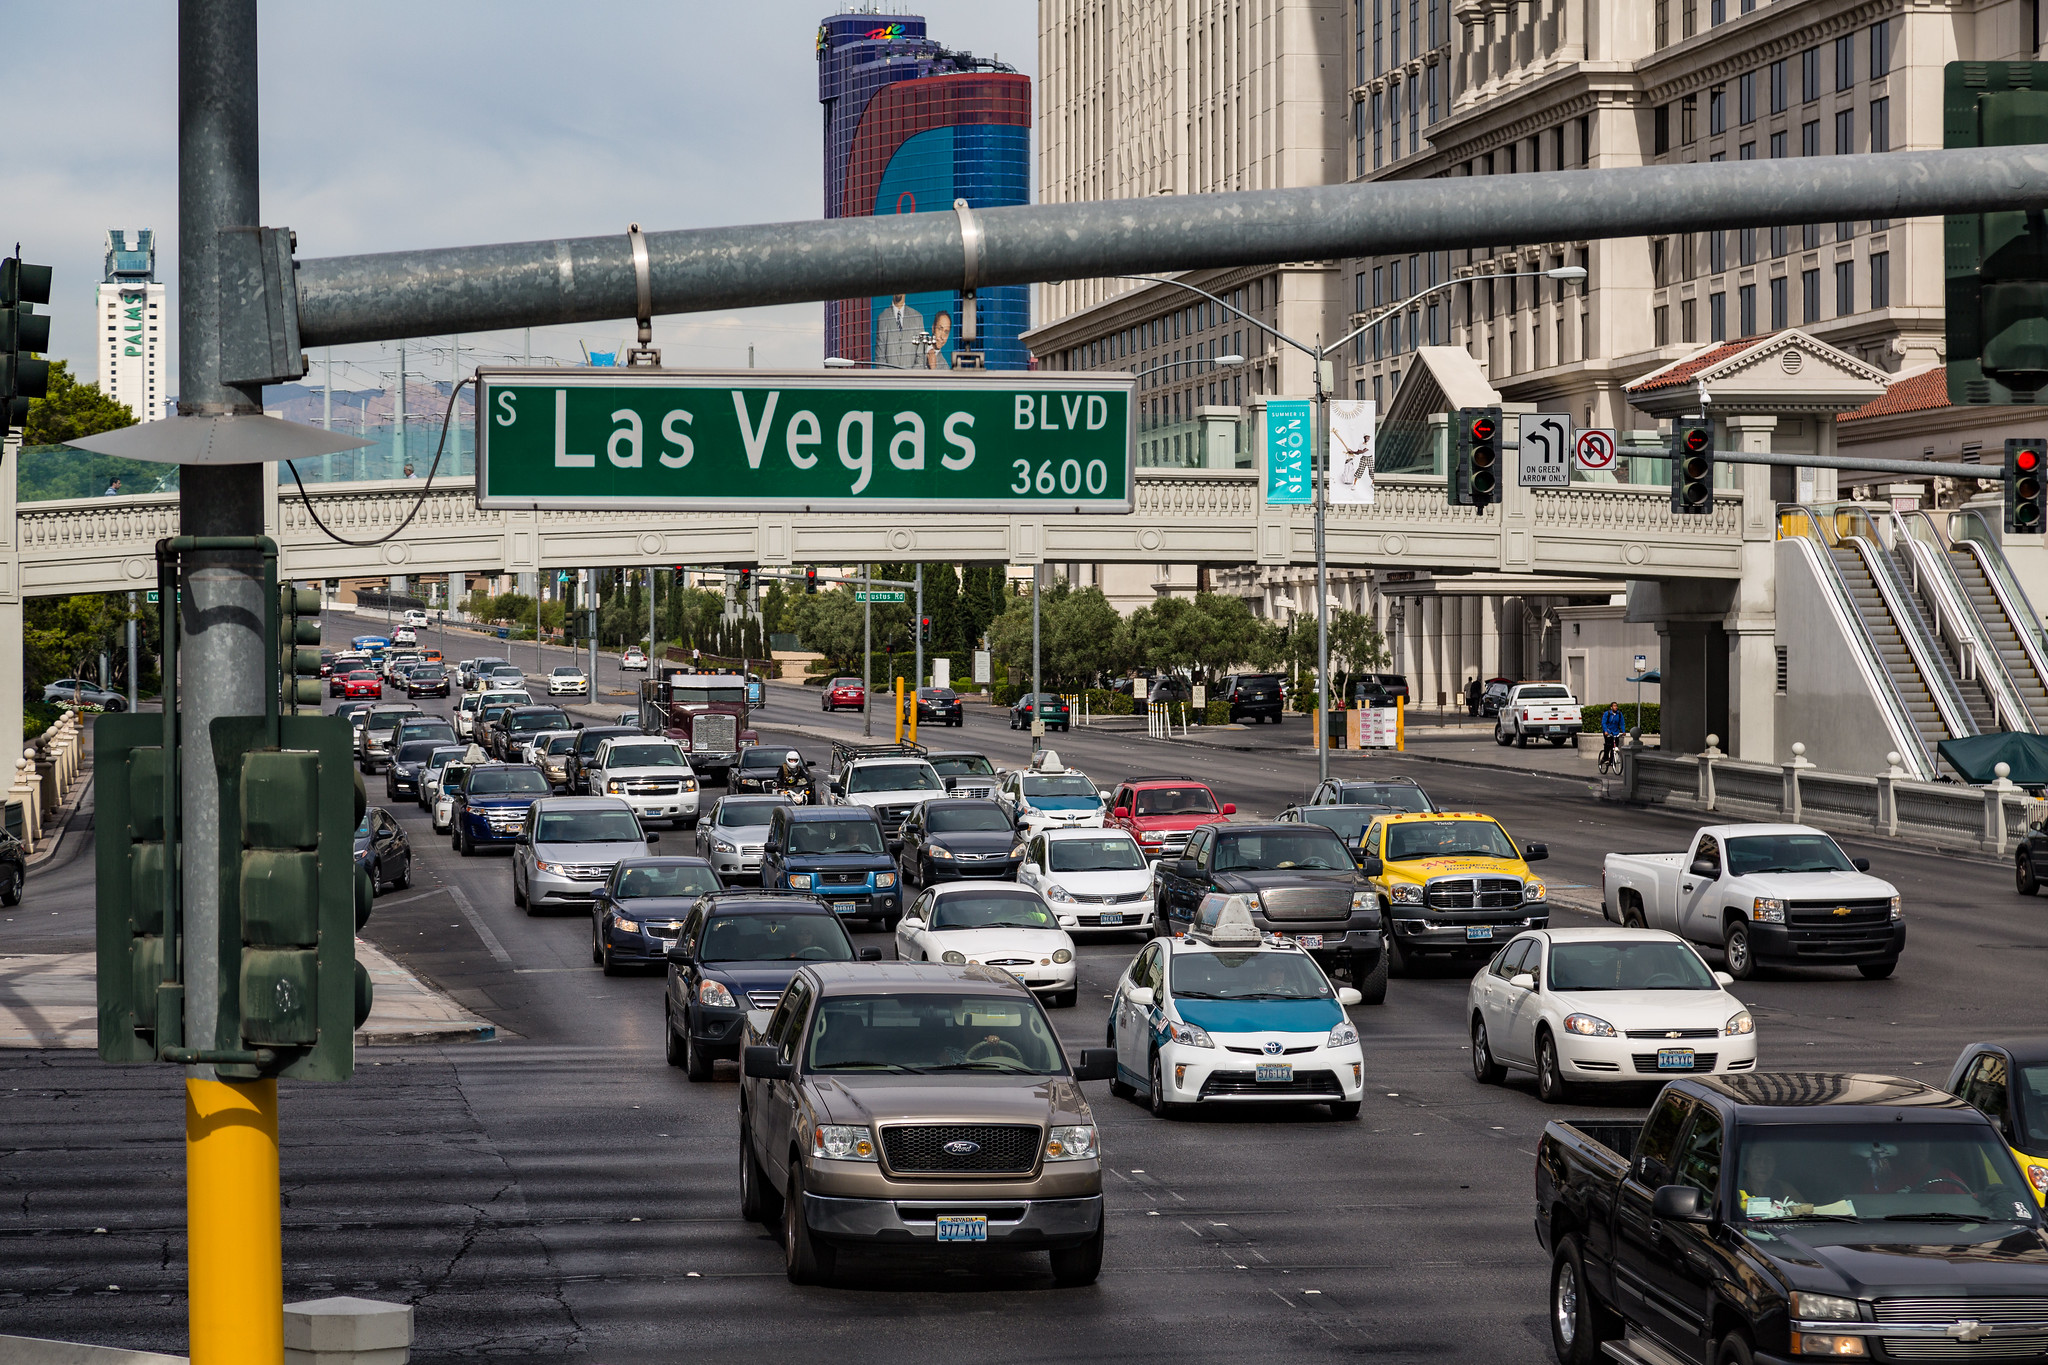
Thanks to sturdy bridges, good roads, and a decent public transit options, Nevada has the best transportation infrastructure in the country, according to a U.S. News and World Report ranking.
Nevada led the way in the publication’s rankings of the best states for transportation infrastructure which were determined by residents’ average commute time, use and prevalence of public transit, and the quality of a state’s roads and bridges.
The Silver State scored well in all four categories, placing second among the 50 states in bridge quality, 10th in public transit usage, 16th in road quality, and 22nd in commute time, according to the U.S. News survey.
But Nevada has room to improve with more accessible transit and a reduction in emissions, according to residents.
The state is nearly done with its three-year Project Neon plan to widen 3.7 miles of interstate 15, the largest public works project in Nevada history. But residents have been clamoring for more transit.
Clark County is also adding more pedestrian walkways on Las Vegas Boulevard to make it easier for those traveling on foot to navigate the Strip.
And Southern Nevada’s Regional Transportation Commission is considering a plan for bus rapid transit along Maryland Parkway between downtown Las Vegas and the airport to ease congestion, although three-quarters of Las Vegas public commenters favor light rail on the line which could be a challenge due to its $1-billion price tag. But linking Las Vegas and Los Angeles via a $7-billion high-speed rail line is at least getting looked at.
Western states largely occupied the top 10, with Utah placing second overall. Delaware ranked third, followed by Minnesota in fourth, Oregon in fifth, and Wyoming, Florida, Tennessee, Montana, and Arizona rounding out the top 10.
Rhode Island ranked at the bottom overall, due to the prevalence of some of the worst roads and bridges in the country. West Virginia was 49th, followed by Pennsylvania, Texas, and Mississippi.
But the rail-dependent Mid-Atlantic states dominated the public transit usage subcategory, which measured the average miles traveled on public transportation by state residents in 2016.
New York topped that list with 42 miles per person, followed by New Jersey in second place, Maryland — partly capitalizing on Washington D.C.’s transit system — in third, and Washington and Illinois rounding out the top five.
Mississippi had the worst public transit in the country. Residents there traveled a measly one mile per person on average, with Wyoming, South Dakota, Arkansas, and Montana following close behind.
But commuting time was a different story. New York ranked 50th with the longest average travel times for workers in 2017, followed by Maryland and New Jersey. Commuters in those states traveled more than 30 minutes to their jobs, a few minutes longer than the average American worker’s ride of 27 minutes, according the U.S. Census Bureau's American Community Survey.
If you want a commute shorter than an episode of "The Big Bang Theory," head to North Dakota, where it will take you a mere 17 minutes to get to your employer.
The state rankings were part of U.S. News’s broader annual “Best States” rating quality of life that also marked ratings for education, economy, crime, natural environment, and opportunity.


