Do you have the sense that transit in your city could be a lot better, and you want to show your local elected officials what needs to improve? Look no further: Chicago's Center for Neighborhood Technology has produced a new tool called AllTransit that assesses the quality of transit down to the neighborhood level.
AllTransit lets you evaluate your local transit system in several ways. You can look up how many people in your city live within a half mile of transit service, for instance, or how many jobs are conveniently accessible via transit from your neighborhood compared to your city as a whole.
The tool combines route and schedule information from 805 American transit agencies with a wealth of Census data, making a broad spectrum of uses possible. With AllTransit, you can compare different facets of transit service across neighborhoods, cities, regions, states, or electoral districts.
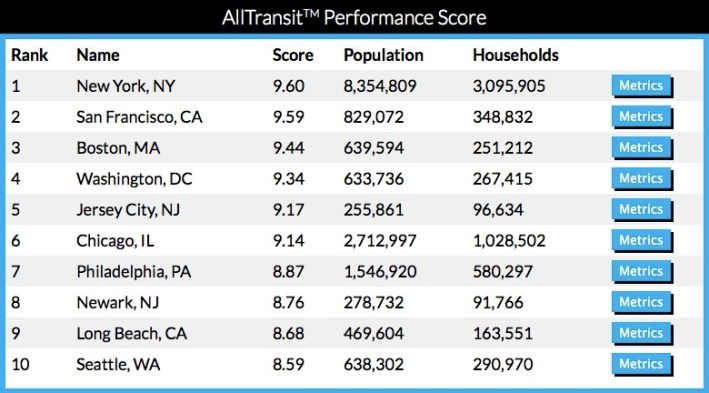
To help people summarize complex comparisons, AllTransit offers an overall "performance score" incorporating several factors, including the extent of frequent service and how well transit connects people's homes to jobs and other destinations.
The emphasis on frequency is unprecedented, said Linda Young, director of research for CNT. "Frequency is so important because it’s really the determinant of how people are going to use transit," she said.
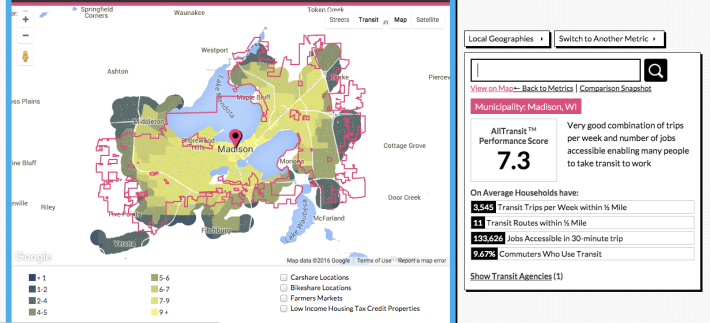
Here are a few ways you can use the tool, with Madison, Wisconsin serving as an example. Keep in mind that this is by no means a comprehensive list. Below are the city's performance score and top-level stats -- click to enlarge.
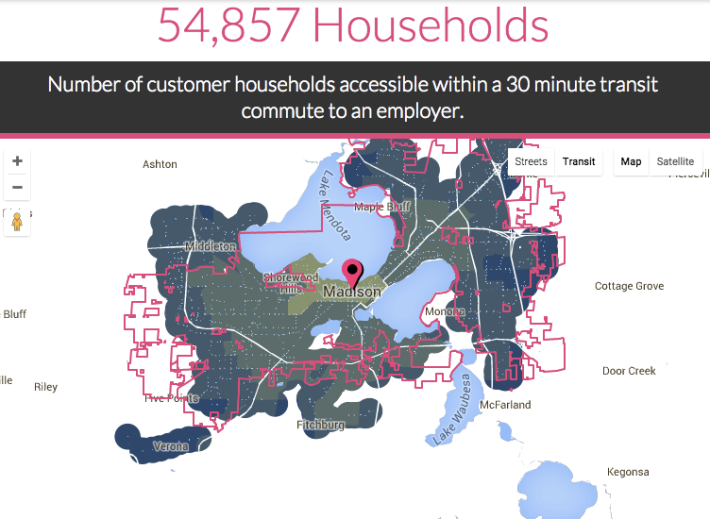
You can drill down and look at transit accessibility from a number of perspectives. Employers looking to see how many people could get to a potential workplace via transit in a reasonable amount of time, for instance, can call up this view:
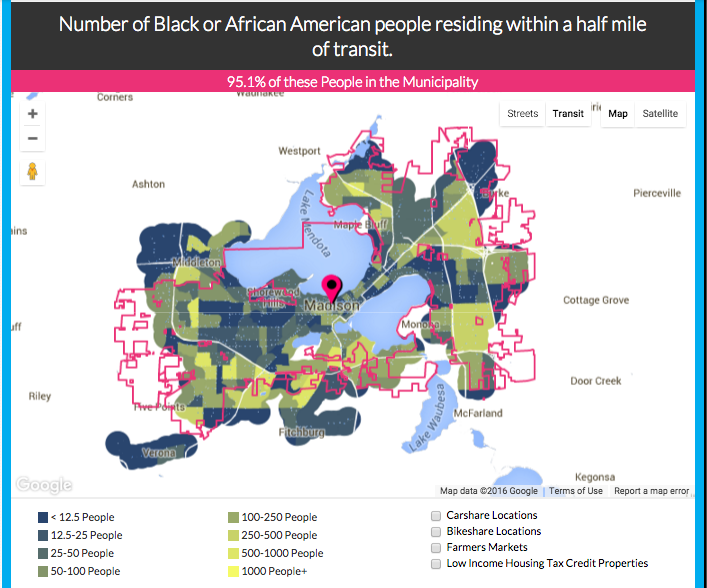
You can also layer in demographic data to see how well different populations are served by transit. This map shows the share of black residents in Madison who live within half a mile of transit:
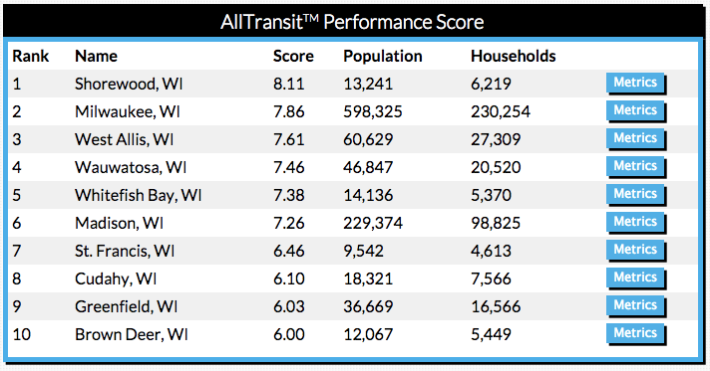
AllTransit's ranking feature lets you look up the top performance scores within a given area. Madison rates sixth among Wisconsin cities and towns with more than 5,000 residents:
This only scratches the surface of what you can do with AllTransit.
CNT and TransitCenter, which funded the project, see AllTransit as a powerful tool to help local transit and housing advocates, public officials, business leaders, and other interested parties understand the strengths and weaknesses of transit in their communities and make compelling arguments to improve it.
