REPORT: Here’s Where People of Color Can’t Access Opportunity Without A Car
Join us in July at the National Shared Mobility Summit — a month of virtual sessions on one topic: THE BIG SHIFT. Our existing physical, social, economic, technological and institutional infrastructure overwhelmingly favor private car ownership and private car use. This year, we ask, “How might we shift the the whole system!” Register now and save 25 percent with code BIGSHIFT21.
Even the most transit-rich cities in America are failing to connect people without cars — who tend to be disproportionately low-income or people of color — to job opportunities, a new analysis finds.
Analysts at TransitCenter comprehensively measured disparities in public transportation access among demographic groups in six major cities between February 2020 and February 2021, a period during which some of society’s most enduring inequities were only magnified by the COVID-19 pandemic.
All six of the cities analyzed in the group’s new Transit Equity Dashboard — Chicago, Los Angeles, New York, Philadelphia, the San Francisco Bay Area, and Washington — rank in the top 10 largest transit systems in the United States by ridership (a seventh portal for the Boston region is forthcoming). Nonetheless, TransitCenter found that having public transportation doesn’t mean it’s getting people where they need to go — and that there are huge gaps in access between the most- and least-privileged residents.
“People of color are more likely to commute by transit than White people are, but far more jobs are accessible by driving than by transit,” the report found. In Chicago, seven times as many jobs were reachable by driving than by transit — and in Los Angles, a whopping 17 times as many were. Nationwide, Black households are the group least likely to have access to a private motor vehicle.
Of course, even a person who color who does have a transit stop right on his block isn’t always able to comfortably or affordably access opportunity via that route alone. Unlike typical measures of “access” like those required by Title VI of the Civil Rights Act — think geographic proximity to a bus route, or how often a train comes to a workers’ neighborhood station — the team at TransitCenter studied a holistic array of variables that might affect a commuter’s ability to get around. Among those variables were the price of a ticket, how often a bus arrives on time, and even whether the closest train route connects a resident with the third-closest pharmacy, rather than simply the closest one, which may not offer affordable prices.
“Existing evaluations of equity in U.S. transit systems basically ask, ‘Where do people live?’ and ‘Where is transit located?’ — end of story,” said Mary Buchanan, who co-authored the report. “They’re not really doing a good job of illustrating how good public transit is at getting people where they need to go, or how that varies across different groups of people.”
Underfunded transit agencies have, historically, lacked the resources to do this kind of analysis — and advocates couldn’t do it, either, until the popularization of open source general transit feed specification feeds made a trove of mobility data available to the public. As a result, much of the structural racism and classism inscribed in U.S. transit networks long went unquantified, even as advocates decried policies that privileged mobility for some commuters over others.
“In many of our cities, we have this two-tiered public transit system where one mode is more expensive — for example, an express bus system, or a commuter train —— whose main purpose is to transport more affluent, largely White commuters to their jobs in the city centers, and then whisk them back to the suburbs at the end of the day,” said Buchanan. “Then there’s the local system — usually a bus — which is often less expensive and makes more stops in the city center, but it’s also a lot more costly in terms of time, reliability, and ease of use. That dynamic, where transit service for people with more means is more effective and transit for service for everyone else is less effective, is pretty pervasive — and there’s been a lot of research that over time, it discourages [the latter group] from riding transit at all.”
But that racist legacy could be set right — starting with transit agencies, cities, and regional leaders making the effort to understand who their transit networks are leaving behind.
Buchanan hopes that the six cities in the report will use TransitCenter’s analysis as a jumping off point to measure factors for which her team didn’t have data, like access specifically for people with mobility challenges. And she also hopes that even more communities will start digging into their own opportunity metrics — an ambition that’s shared by Sens. Tammy Baldwin (D-Wisc.) and Joni Ernst (R-Iowa), who recently introduced a bill that would establish a pilot program to study the issue.
“All of the methods that we used to create this data would apply to any transit agency that has a GTFS feed,” said Buchanan. “Certainly the principles behind the project would apply to any transit agency that wants to take a rider-focused perspective, and really drill down into what different groups of people need to improve access — and all of them should want that.”
Here are a few of the most eye-popping insights from the report. Read more about each city, as well as insights on Washington, D.C. and Philadelphia, at the dashboard.
Los Angeles
It isn’t just daunting to get to work by transit in the City of Angels — it’s also a challenge to get almost anywhere else. TransitCenter found it took the average public transportation user nearly four times as long to get to a hospital or urgent care center than it took the average driver; in all of the spotlight cities, the trek to the doctor took at least twice as long for non-motorists.
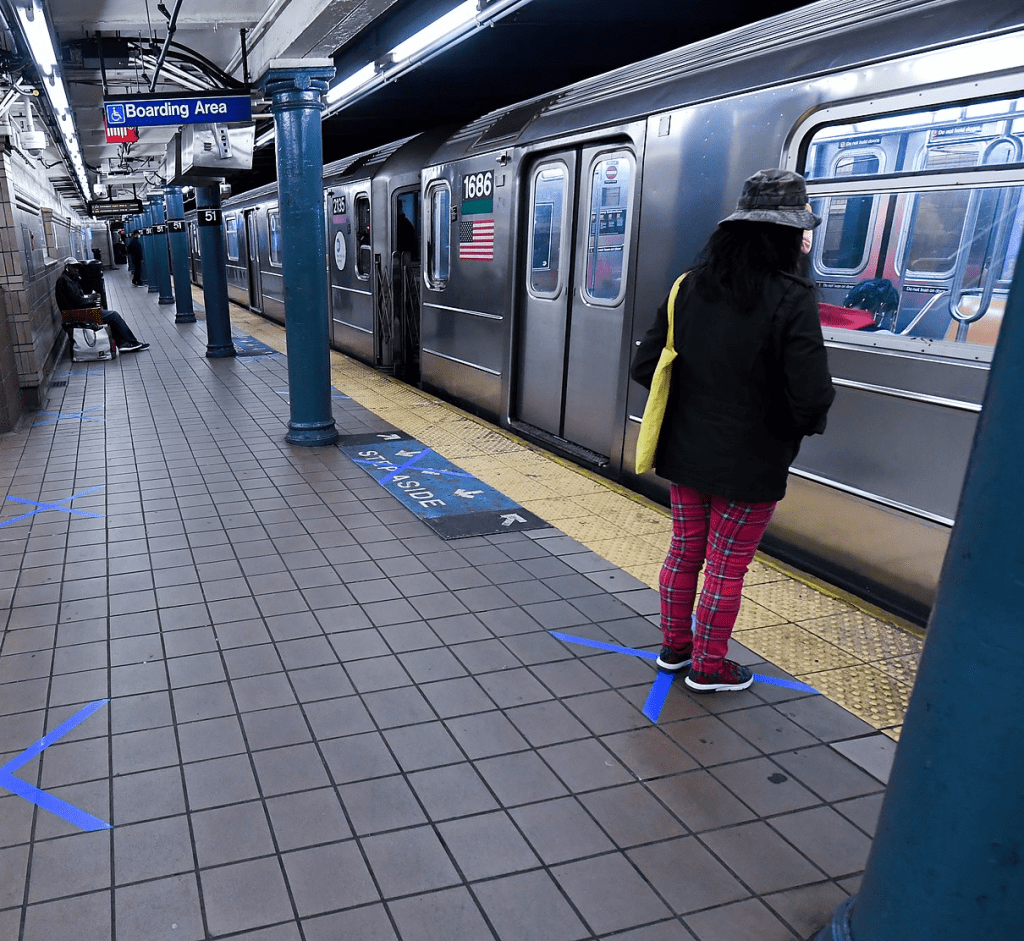
New York City
If you can make it in the Big Apple, you can make it anywhere … but transit makes it a whole lot easier for White people to physically make it to their workplace. The average Black resident of NYC “can access about 45 percent fewer jobs in a 45-minute transit trip than the average White resident,” TransitCenter says — and White riders overall have can access more than twice the number of jobs than riders of all races who qualify for low-cost fare programs, at least on weekdays.
San Francisco and Oakland
Transit agencies across America cut service in the wake of the COVID-19 lockdowns, but even though many of those routes have since been restored, not everyone got the ride back. In the Bay Area, the average rider who works on weeknights could access 143,893 jobs on the week of Feb. 20, 2020, but that number plummeted to 94,523 jobs in April, a drop-off of more than 34 percent. By Feb. 20, 2021, she could still only access 110,119 — 23 percent down from the pre-pandemic numbers. (Visit the dashboard for an interactive version of this chart.)
Chicago
In some cities, transit access stayed remarkably consistent throughout the pandemic — but it also stayed consistently inequitable. In the Windy City, buses and trains came way more frequently for White and Asian weekday commuters, who could grab a ride in their immediate neighborhood an average of 21 and 26 times an hour on weekdays, respectively (though Asian commuters lost one ride per hour by February 2021.) Black riders, by contrast, never got more than 20 chances to ride transit in a single hour — and Latinx riders got just 17.
Put another way: even as a global crisis upended travel patterns and transplanted countless white commuters into home offices, Chicago still failed to re-orient their transit planning to better serve the groups that most needed a ride to work.

Read More:
Streetsblog has migrated to a new comment system. New commenters can register directly in the comments section of any article. Returning commenters: your previous comments and display name have been preserved, but you'll need to reclaim your account by clicking "Forgot your password?" on the sign-in form, entering your email, and following the verification link to set a new password — this is required because passwords could not be carried over during the migration. For questions, contact tips@streetsblog.org.


.jpg)