4 Ways Road Builders Game the Numbers to Justify Highways
The people who make the case for highways often present themselves as unbiased technicians, simply providing evidence to an audience subject to irrational bias.
But traffic forecasting is not a neutral, dispassionate exercise. It is subject to all sorts of incentives, beliefs, and assumptions that can skew the results in a particular direction.
Intentionally or not, forecasters frequently exaggerate predicted traffic volumes to make the case for building toll roads, according to industry consultant Robert Bain [PDF]. Bain has catalogued 21 ways in which forecasters manipulate data to make toll road financing look attractive [PDF]. Gaming numbers isn’t limited to toll roads — DOTs do it for taxpayer-funded projects too.
Here are a few tricks Bain says forecasters use on private projects to make highways seem like a good bet to investors:
1. Pick a time frame that suits you
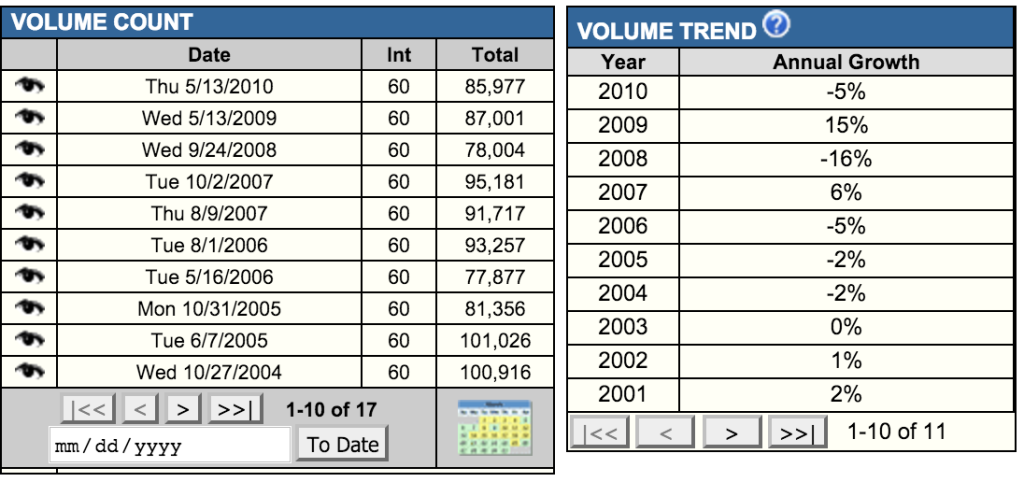
Maybe looking at the last 10 years of traffic doesn’t make that great a case for widening a highway. Why not just pick a different time frame?
To justify its $850 million I-94 expansion project, Wisconsin DOT used traffic data from 1999 through 2010, leaving out two years. But traffic was flat on the road between 2009 and 2012, according to a Wisconsin PIRG analysis, which has pointed out the agency is a notoriously overoptimistic forecaster [PDF].
WisDOT, for its part, says it went with the abbreviated time frame because a construction project depressed traffic volumes after 2009.
2. Assume a suburban development bonanza
Forecasters try to determine how land use will affect traffic. Will sprawling development in the next decade put more cars on the road?
As with many aspects of traffic forecasting, there’s the potential for a self-fulfilling prophecy. Maybe the suburban development that generates more traffic only happens because the road was built. But sometimes that growth never even materializes, as was the case with the bankrupted South Bay Expressway outside San Diego.
In Bain’s view, it’s okay to consider how more development may affect traffic, but “purely speculative developments should be omitted from base case traffic forecasts.”
3. Use projections that depart from historical trends
Let’s say population and traffic growth have been sluggish. Some road builders aren’t squeamish about completely disregarding recent patterns when they want to make the case for building more highways.
Michigan DOT told the Detroit Free Press it expected traffic to grow an astounding 9 percent per year on Interstate-75, where it has proposed a $1 billion widening project. The projection was completely out of line with recent history. Traffic declined 15 percent on a key segment of the road between 2004 and 2010, for example.
When Streetsblog pressed MDOT to explain, the agency revised the projection to 10 percent traffic growth over the next 25 years.
4. Use projections that thoughtlessly mimic historical trends
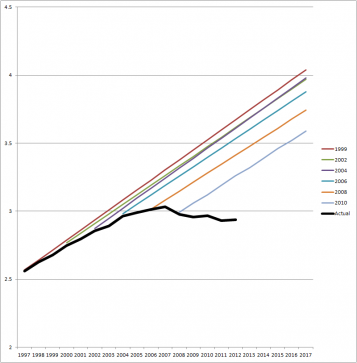
It can be a problem when forecasters ignore historical data. But it can also be a problem when forecasters adhere to historic trends even though there is good reason to believe circumstances are changing, Bain writes.
Almost every state DOT has been guilty of this over the past decade. Until about 2005, the long-term historical trend was steady growth in traffic. Then the pattern started to shift. Few forecasters adjusted their projections in a meaningful way, as highlighted by this composite projection from the State Smart Transportation Campaign, which aggregated traffic forecasts that state and local agencies made to Congress.
There are many other ways forecasts can be manipulated, according to Bain [PDF].
The hard part for outsiders, even seasoned experts, is identifying the distortions so bad forecasts can be debunked. A good place to start, suggests Bain, is to insist that the forecaster reveal all the assumptions that went into the projection.

Read More:
Streetsblog has migrated to a new comment system. New commenters can register directly in the comments section of any article. Returning commenters: your previous comments and display name have been preserved, but you'll need to reclaim your account by clicking "Forgot your password?" on the sign-in form, entering your email, and following the verification link to set a new password — this is required because passwords could not be carried over during the migration. For questions, contact tips@streetsblog.org.