Every Traffic Fatality in the U.S. — Mapped
What is the most dangerous street in your region? Which one most needs improvements to protect cyclists? Where do drunk drivers do the most damage? Thanks to a new tool from New York City data scientist Max Galka, you can get a pretty good sense with a few clicks.
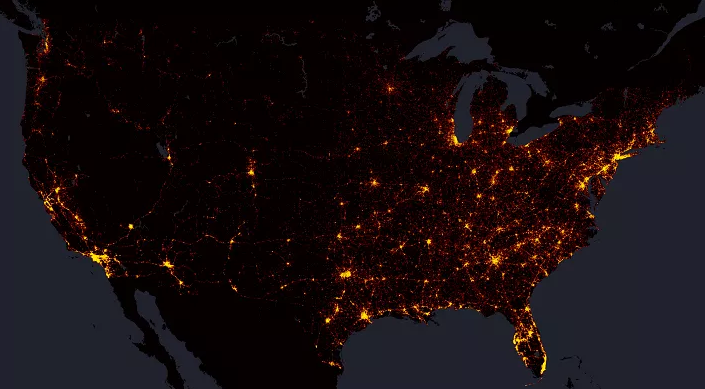
Galka recently completed a map of every traffic fatality in the U.S. between 2004 and 2013, using data from the National Highway Traffic Safety Administration’s Fatality Analysis Reporting System (FARS).
Zoomed out, it looks like a map of population density and highways in the U.S. The real insights come when you zoom in to a local level.
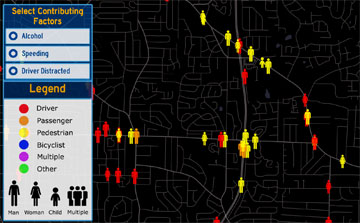
The map is coded to convey information about victims and contributing factors like speeding or drunk driving.
While a handful of cities make more detailed traffic crash information available publicly online, in most places, Galka’s map can provide fresh insight into the scale of traffic violence on our streets. You can locate your own neighborhood by entering your address in the search bar.
Galka told Streetsblog he tried to stay away from interjecting his views too strongly into his analysis, but his work on the map revealed a couple of things.
“What struck me most was the number of accidents that were likely preventable,” he said. “Fifty-eight percent were caused by either alcohol, speeding, or driver distractions. In particular, speeding appears to be far more dangerous than I realized.”

Read More:
Streetsblog has migrated to a new comment system. New commenters can register directly in the comments section of any article. Returning commenters: your previous comments and display name have been preserved, but you'll need to reclaim your account by clicking "Forgot your password?" on the sign-in form, entering your email, and following the verification link to set a new password — this is required because passwords could not be carried over during the migration. For questions, contact tips@streetsblog.org.