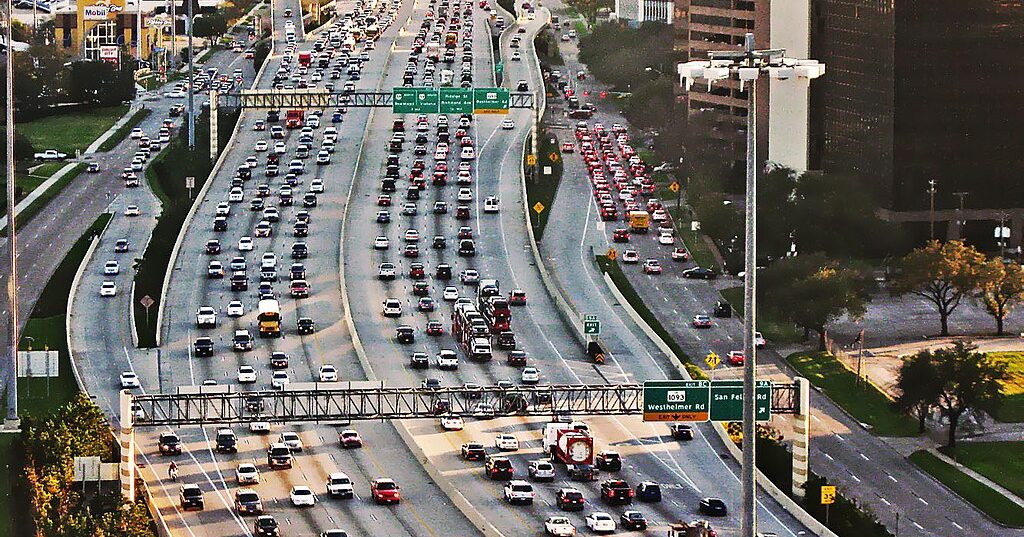
Transpo Agencies Are Terrible at Predicting Traffic Levels

This chart contrasts state DOTs' projected traffic volumes with those actually recorded by the Federal Highway Administration. Image: ##http://www.ssti.us/2013/12/new-travel-demand-projections-are-due-from-u-s-dot-will-they-be-accurate-this-time/?utm_source=SSTI+Community+of+Practice+Master+List&utm_campaign=cbd2d0b53a-December_6_2013_newsletter12_16_2013&utm_medium=email&utm_term=0_f54dd1d9a6-cbd2d0b53a-45447449## SSTI##
Combined traffic projections from state and regional transportation agencies (the colored lines) have been wildly off the mark (the black line shows real traffic levels) for more than a decade. Image: ##http://www.ssti.us/2013/12/new-travel-demand-projections-are-due-from-u-s-dot-will-they-be-accurate-this-time/?utm_source=SSTI+Community+of+Practice+Master+List&utm_campaign=cbd2d0b53a-December_6_2013_newsletter12_16_2013&utm_medium=email&utm_term=0_f54dd1d9a6-cbd2d0b53a-45447449##SSTI##

Americans’ travel behavior is changing dramatically. It seems like not a week passes without a new report about the decline in driving. But are state and local transportation agencies — which are responsible for much of the nation’s highway and transportation planning — keeping up with the facts on the ground? A review of the evidence by the State Smart Transportation Initiative finds the answer is a definitive “No.”

Forecasts and assumptions about ever-increasing traffic are often used to justify agency decisions to expand roads. But these assumptions are increasingly divorced from reality. In fact, state and regional agencies aren’t just wrong some of the time. State DOTs and metropolitan planning organizations are getting it wrong every year, over and over again, by significant margins, according to SSTI’s analysis.

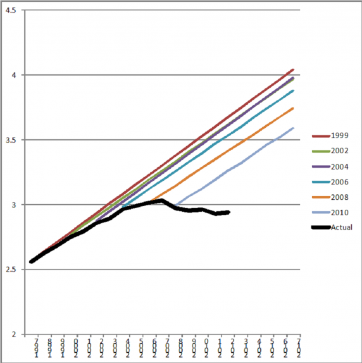
In their most recent reporting to the Federal Highway Administration, state and regional transportation agencies used data from 2008 to predict that traffic volumes would reach a combined 3.3 trillion miles nationally in 2012. Last year, a few months after that forecast was publicly released, real-world data already showed that the forecast wasn’t even close. Transportation agencies had collectively overestimated how many miles Americans would drive in 2012 by 11 percent. That is the equivalent of adding five “average-sized” states to the total, SSTI reports.

What’s worse, these wildly incorrect traffic assumptions are routinely used to justify costly road expansions.

SSTI reviewed every 20-year traffic forecast submitted by state and regional agencies to FHWA since 1999 (these predictions are in a document called the Conditions and Performance Report to Congress). It turns out that the 20-year projections overestimated future traffic volumes in every single year the reports could be compared against data on actual miles driven by Americans. The 1999 report, for example, overestimated actual driving in 2012 by a whopping 22 percent.

SSTI’s Eric Sundquist concluded that states and MPOs “generally have not updated their models and assumptions to account for current conditions, as if they expect the year to be 1980 forever.”

ALSO ON STREETSBLOG

Driving Declines Spell Big Trouble for Turnpikes

|
What the New Jersey Turnpike Authority did in 2005 was no different than what almost every other state and regional transportation agency was doing at the time. It predicted that traffic volumes would rise at a healthy clip every year for about 30 years into the future. Then it estimated its revenues based on those […]

Deranged Traffic Projections Could Cost Wisconsin $3 Billion

|
The advocates at 1000 Friends of Wisconsin recently completed a report [PDF] evaluating the Cheese State’s traffic projections. The organization compared actual traffic levels with Wisconsin DOT projections on 11 highways where the state has proposed adding lanes. The total cost of the proposed expansions is $3 billion. The report found that the state’s professional traffic modelers […]

Federal Court: Wisconsin Uses Bogus Traffic Data to Justify Highways

|
State departments of transportation all over the country use specious traffic projections to justify hugely expensive road widening projects. That’s how you end up with the graph on the right — showing how DOTs continued to forecast traffic growth year after year, even as driving stagnated. Wisconsin DOT is perhaps the most notorious manipulator of traffic […]