A few years ago, the Center for Neighborhood Technology gave a wonderful gift to urbanists and planners: the Housing + Transportation Index. This simple calculation clarified and popularized a key concept: that transportation costs must be taken into account in any measurement of “affordability.”
Without that, potential homebuyers and renters make the mistake of “saving” money by buying a home far outside the city, only to see those savings vanish when they end up driving multiple cars hundreds of miles per week, racking up fuel and maintenance expenses. The H+T index is a simple tool for making better decisions -- for families, for planners, and for the federal government.
Today, U.S. DOT and HUD announced that they’re launching a new version of H+T. They’re calling it the Location Affordability Index, and CNT helped develop it. LAI differs from H+T in some key ways (here’s an infographic detailing those differences) but at its root, it gets at the same important question: Where is the best place to live without breaking the bank?
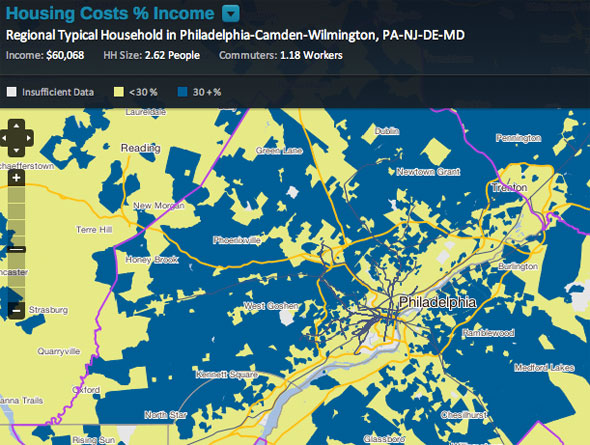
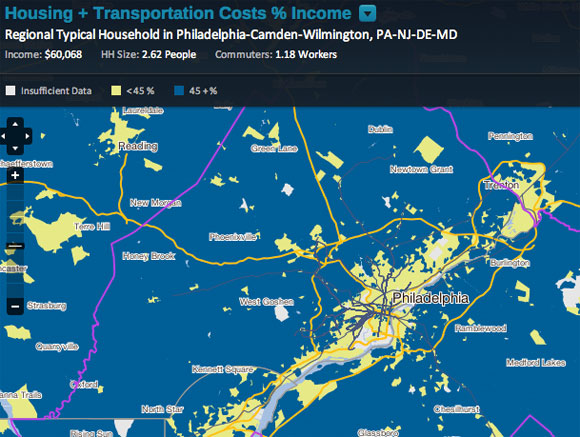
CNT answers that question by showing the huge variations between two maps: one that shows places where the median household pays 30 percent or more of their income on housing, and one that shows places where those households pay 45 percent or more of their income on housing and transportation combined.
The maps show how intimately linked transportation and housing are when determining cost of living, as HUD Secretary Shaun Donovan told reporters today. “For any housing community to succeed, its residents need to be able to get to work, its young people need to be able to get to school, and its families need to be able to access critical resources and services they need,” Donovan said.
Donovan noted that for most families, transportation is their second-highest monthly expense, after housing, but said transportation costs aren’t always so easily tabulated. You don’t get one transportation bill in the mail, the way you get your mortgage or rent bill. Transportation costs are paid in dribs and drabs -- a tank of gas here, a bus fare there, a parking ticket, a taxi ride, an oil change. The LAI index helps quantify how those costs add up, and see if the transportation requirements of a particular geographic area render it unaffordable.
“It can sometimes be tricky to weigh the pros and cons of all of these options,” said Transportation Secretary Anthony Foxx. “Does it make more sense to live in a community where you have to drive to work every day? Or might it be a better bargain to live where you can walk, bike or ride public transportation? That’s where the Location Affordability Portal comes in.”
“This tool can show a Dallas family living in Sunnyvale that they spend an average of 22 percent of their household budget on transportation, which they could also compare to 14 percent in nearby Oaklawn,” Foxx said. “And in Des Moines, a family living downtown spends 7 percent less on transportation costs than one living in Altoona.”
Of course, the availability of transportation options and the ability to see average household expenditures doesn’t necessarily tell a family with certainty what they’ll spend. But it opens up that conversation and invites people to calculate those sometimes hidden costs.
“I would argue that had we had a tool like this going into the housing crisis and the bubble that we experienced, I certainly wouldn’t argue that it would have solved that problem, but I think it could have helped ameliorate some of the worst effects that we saw,” Donovan said. “Too often we saw individual families buying homes they thought they could afford without factoring in the transportation costs.”
The agencies are calling the new portal a tool for families, housing counselors and community planners to make better decisions -- but they want to see it “road-tested” before they put their full confidence behind it. U.S. DOT and HUD aren’t yet using the LAI themselves to determine how to direct grant money, where to build public housing, or whether to underwrite a mortgage. It’s good enough for local policymakers to use, they indicated, but not the federal government.
Still, if this tool could have helped avoid some foreclosures during the depth of the housing crisis -- or could help prevent a repeat -- that sounds like an argument for a federal interest in using this metric.