CNT Busts “Drive Till You Qualify” Myth in the D.C. Region
Maybe we can finally lay the whole “drive till you qualify” myth to rest now.
You probably already suspected that driving farther and farther outside the city limits until you found a house you could afford was not the smartest way to go about buying a home. You may have been tipped off by the fact that the word “drive” was in that not-so-sage piece of advice.
Well, your suspicions are confirmed. The Center for Neighborhood Technology has long been a champion of what they call the H+T (Housing + Transportation) index. They say that instead of measuring affordability strictly by housing costs (typically determined to be “affordable” if housing eats up less than 30 percent of household income), we should look at a combined index and determine affordability as a home where housing costs plus transportation costs make up less than 45 percent of income.
To make this real for the people of the national capital region, CNT teamed up with Washington, D.C.’s forward-looking Office of Planning to analyze how the H+T index changes notions of affordability in the D.C. area. Their report, "H+T in D.C.: Housing + Transportation Affordability in Washington, D.C." [PDF]
In her foreward, Planning Director Harriet Tregoning (who, incidentally, got hit by a car on her bike last week) says that she wanted to go deeper than the CNT’s previous research, which used 2000 census data. She wanted to know what had happened during the “turbulent period” between 2006 and 2008.
“During that time some outer jurisdictions experienced drops in the median home sales price of 41 percent, while the District’s median sales price dropped by only 2 percent,” she wrote. “This happened while real gas prices grew by 18 percent.”
In any given location, transportation costs vary inversely to housing costs – meaning that in walkable, compact neighborhoods where transit access is convenient and housing prices are high, transportation costs are low – in some cases, low enough to offset the higher cost of housing.
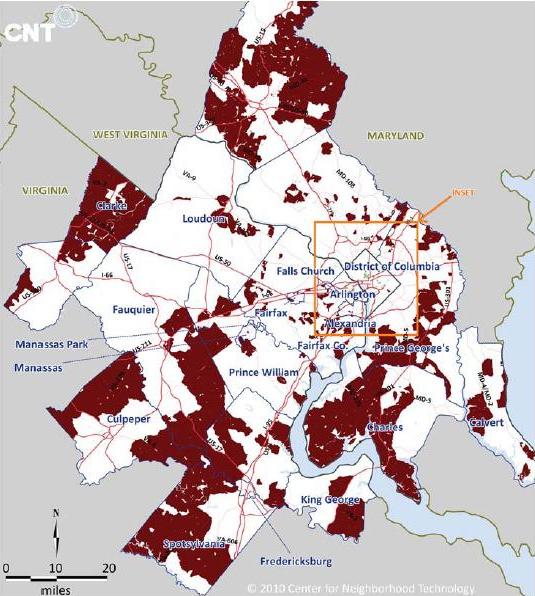
It becomes apparent that “affordable” housing in the farthest-reaching areas of the region is much less so when transportation costs are added. Average H+T burdens in Spotsylvania, Charles, and Calvert counties are largely over 45 percent of AMI [area median income], and even exceed 55 percent of AMI in areas. Conversely, the District of Columbia, Prince George’s County, Arlington County, and Alexandria present some of the most affordable areas in the region. Here, even where housing costs are relatively high, average H+T burdens are largely less than 45 percent of AMI.
Indeed, in the map above, CNT makes its point more clearly than anywhere else. The areas in red are places that go from “affordable” (?30 percent of AMI spent on housing) to “unaffordable” (?45 percent spent on H+T) when transportation costs are considered. There’s a lot of red in the D.C. region. In these places, we see a tipping point: CNT says that with a commute distance of approximately 15-18 miles, average household transportation costs can actually exceed housing costs.
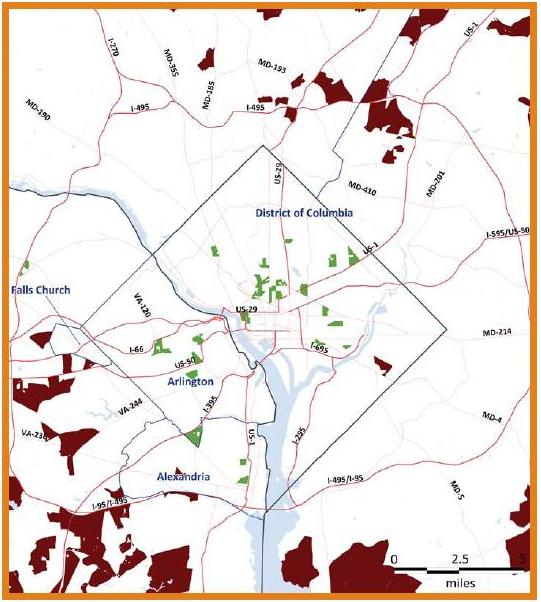
There’s a whole lot less green in the map below, showing where location efficient areas become affordable when accounting for transportation. Apparently transportation savings just can’t make up for the astronomically high home prices in some of the most transit-friendly and walkable areas of the D.C. area. This underlines two important points: demand for those neighborhoods is so enormous these homes can command these high prices, and supply just isn’t keeping up enough to make these attractive homes affordable to everyone.
CNT isn’t content to paint walkability and transit access with broad strokes and call that the recipe to low transportation costs. First of all, they make no assumptions about car ownership and car use: they take the data on car ownership from the 2000 US Census and the 2006–2008 American Community Survey and used odometer readings to determine vehicle miles traveled. Second, they’re precise about what they mean by walkability and transit use.

In the sidebar, left, they spell out how different neighborhood characteristics affect different transportation behaviors, which in the end paint a picture of total transportation costs. And, in turn, they’re clear about what each of these variables mean. For example, they explain that smaller blocks are useful because they “typically mean greater street connectivity, more intersections, and shorter routes between points, thus enabling households to drive fewer miles.”
So, among inner suburbs, Arlington is more successful at reducing transportation costs than the parts of Montgomery County that are along the Metro red line. There are several factors that contribute to this, apart from the fact that both have very successful transit lines.
Residential and gross density in Arlington are both higher, transit access is higher, and average blocks are smaller, suggesting that Arlington is a more walkable, bikeable, and transit-oriented area with more destinations in close proximity. Perhaps the most significant difference is in job access. With its greater proximity to the District and the high concentration of jobs there and in Arlington, commuters have less distance to travel and more transit options.
In some cases, it’s not even close:

Neighborhoods inside the city have similar patterns, with Columbia Heights keeping transportation costs down, relative to Tenleytown, by housing about seven times as many households per acre and twice as many jobs.
The potential impact of this study is significant. CNT says they hope more people will recognize that “there is more to housing affordability than ‘drive ‘til you qualify,’” especially as gas prices continue to rise and denser neighborhoods show their superior resilience to economic downturns. Communities that pay attention to this report and are open to change can increase affordability by “targeting growth in location-efficient areas where households are not auto dependent.” And CNT hopes it will silence “misinformed criticisms” that building transit is too costly, “since these critiques do not fully account for the benefits or take into account the hidden costs associated with sprawl and auto dependency.”
In his analysis of the report, Greater Greater Washington’s David Alpert suggests a path forward for the D.C. region. He says that since the most affordable places, considering H+T, are the east side of D.C. and Prince George's County inside the Beltway, that’s a good place to start to “add housing capacity to the underutilized Metro stations and other places where, historically, developers and banks have been unwilling to invest.”
Indeed, the CNT report is a clarion call to communities that have been forcing low-income people into transit-poor suburbs where housing is cheap but transportation costs are high.
“We are at a critical time for the region,” says Dave Robertson, Executive Director of the Metropolitan Washington Council of Governments. “We need to address the market pressures around our transit stations that force low-income families away from transit and develop a regional plan to channel growth around our transit investments that creates complete communities.”
Stay in touch
Sign up for our free newsletter
More from Streetsblog USA
Friday’s Headlines Are Down on Highways
Two outlets recently featured articles on the harmful effects of ongoing freeway projects.
Commentary: There is Zero Ambiguity to the West Portal Tragedy
What happened in West Portal was entirely predictable and preventable. The city must now close Ulloa to through traffic and make sure it can never happen again.
Talking Headways Podcast: Details of Development Reform in Minnesota, Part I
Jim Kumon of Electric Housing discusses his work as a developer and urban policy educator in the Twin Cities.

Thursday’s Headlines Don’t Like Riding on the Passenger Side
Can you take me to the store, and then the bank? I've got five dollars you can put in the tank.
Study: When Speed Limits Rise on Interstates, So Do Crash Hot Spots on Nearby Roads
Rising interstate speeds don't just make roads deadlier for people who drive on them — and local decision makers need to be prepared.