How Does Your State Stack Up on Prioritizing Transit and Street Safety?
How’s your state doing on bike and pedestrian investment? Transit? Bridge repair?
Congress just reauthorized the national law that funnels tens of billions of dollars each year to state departments of transportation, but tracking how these agencies spend all their federal money is notoriously difficult. A lack of uniformity in the way states report spending has made it difficult to compare these numbers, even though all states are required to abide by certain federal filing standards. The Tri-State Transportation Campaign recently sorted through piles of documents to establish a basis for comparison.
Their new report, “Tracking State Transportation Dollars” [PDF], breaks down the funding levels for each State Transportation Improvement Program, or STIP, a document that lists all projects that states plan to fund with federal dollars. Although the STIP doesn’t account for all of a state’s transportation funding, it does reveal some interesting patterns.
Overall, states spend an average of 20 percent on transit, the report found. Bicycle and pedestrian programs made up an average of 2 percent. Meanwhile, states are spending an average of 38.5 percent of the STIP on maintenance, and about 22.5 percent to add or expand roads and bridges.
The results also reveal wide variations from state to state, made available in a handy interactive map.
Hawaii — thanks to its construction of a major passenger rail system — is the only state to best New York in transit spending, devoting 74 percent of its STIP budget to transit. The Empire State, with a much larger system to maintain, stands at a still-formidable 62 percent. Virginia is another standout at 49 percent, with Colorado (44 percent) and Utah (42 percent) not far behind. Meanwhile, Nebraska (1 percent), Mississippi and Kentucky (2 percent each) exemplify states on the lower end of the transit-spending spectrum.
Meanwhile, North Carolina is the worst sprawl-inducer, spending 58 percent of its STIP on expanding highways. Arizona and Arkansas also spend more than half of their STIP on adding roads, with Indiana (45 percent), Mississippi (also 45), and Texas (36 percent) especially prone to highway expansion as well. Not surprisingly, several of these states also devote a low proportion of their STIP to maintenance, with Texas and Arizona giving just a shred to upkeep of their existing transportation network.
You have to be cautious about making comparisons, however, says report author Renata Silberblatt.
Some states may be devoting a larger portion of their budget to a particular area because of a large ongoing project — as is the case with transit in Hawaii. Also, other funding sources are available to states that might not be recorded in the STIP — including public-private partnerships, toll authorities and infrastructure banks — and that money isn’t accounted for in this report.
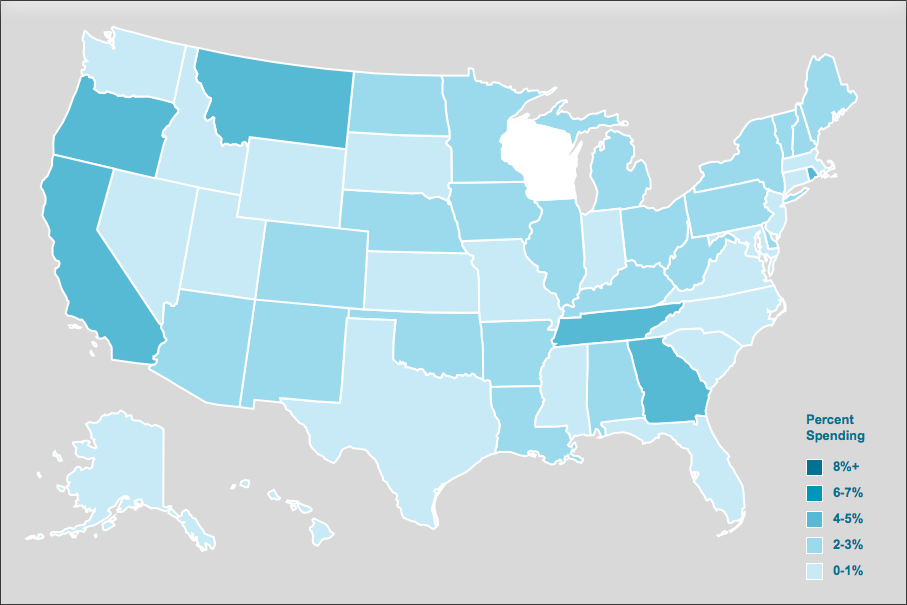
The report also attempts to ascertain how much states spend on biking and walking. But again, it isn’t easy, even within the STIP. Tri-State measures both what states are spending on stand-alone bike and pedestrian projects and what states are spending on road projects that include some bike or pedestrian element. Many states do not report costs for sidewalk construction, for example, if it is part of a larger road project.
Oregon, Tennessee and Georgia lead in the percent of the STIP they spend on stand-alone biking and walking projects, each with 5 percent. California and Montana follow with 4 percent. Meanwhile, Washington State is by far the leader when it comes to complete streets-type projects, spending 28 percent of its STIP on road projects that incorporate infrastructure for walking or biking, well above the next-best state in this category, Vermont (13 percent).
Tri-State hopes the report will help build support for national reporting reforms that make it easier to see how state DOTs allocate billions of transportation dollars every year, and to analyze the impact of those decisions.
“Increasing the transparency and uniformity in each state will go a long way in helping state transportation agencies be more accountable to the people who are affected each day by the agencies’ decisions – the public,” Silberblatt writes. “But transparency and accountability need not be a one way street; giving the public a better grasp on the state’s transportation investments has been shown to increase support of the agency’s work.”

Read More:
Streetsblog has migrated to a new comment system. New commenters can register directly in the comments section of any article. Returning commenters: your previous comments and display name have been preserved, but you'll need to reclaim your account by clicking "Forgot your password?" on the sign-in form, entering your email, and following the verification link to set a new password — this is required because passwords could not be carried over during the migration. For questions, contact tips@streetsblog.org.