Maps Show Striking Link Between Car Commuting and Obesity
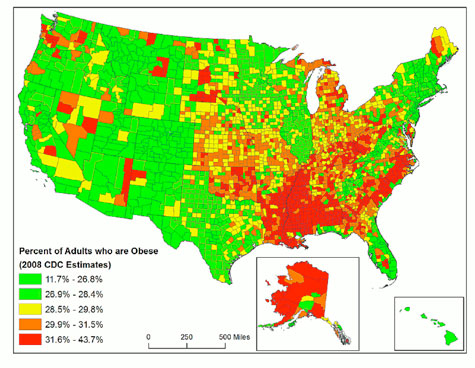
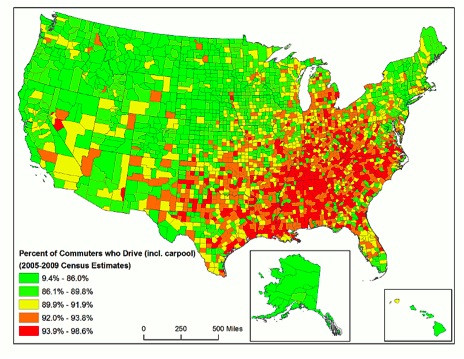
Check out these two maps, the first showing obesity rates (by county) in the United States and the second showing the percentage of commuters who travel by car (via Planetizen).
Researchers Anne Price and Ariel Godwin at Planetizen caution readers not to conflate correlation and causation. However, when comparing other economic and demographic characteristics (unemployment, educational attainment, income), no other maps displayed such striking similarities.
Furthermore, when the research team created a scatterplot comparing obesity rates in U.S. counties with commuting patterns, a “strong relationship” emerged.
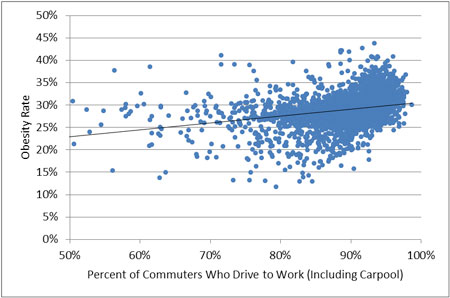
Again, Price and Godwin were cautious about drawing a direct causal relationship:
Considering that the percentage of active commuters in the U.S. is quite small, it is unlikely that walking and biking make any significant contribution to reducing the obesity rate in particular counties. More likely, counties with the highest percentage of walkers and cyclists also share other common characteristics that are driving this trend. Perhaps lower rates are driven by a cumulative effect of a more affluent and educated population. It may also be that counties with higher rates of active commuting have policies and cultures that have led to higher rates of physical activity overall.
Sounds like more research is needed — in addition to more transportation choices in the southeast and Appalachia.
It would also be interesting to examine whether the availability of alternatives to single occupancy vehicle travel contributes to some of the better economic indicators in some of the nation’s less obese, wealthier areas.

Read More:
Streetsblog has migrated to a new comment system. New commenters can register directly in the comments section of any article. Returning commenters: your previous comments and display name have been preserved, but you'll need to reclaim your account by clicking "Forgot your password?" on the sign-in form, entering your email, and following the verification link to set a new password — this is required because passwords could not be carried over during the migration. For questions, contact tips@streetsblog.org.