Talking Headways Podcast: Measuring the Pulse of Urban Development
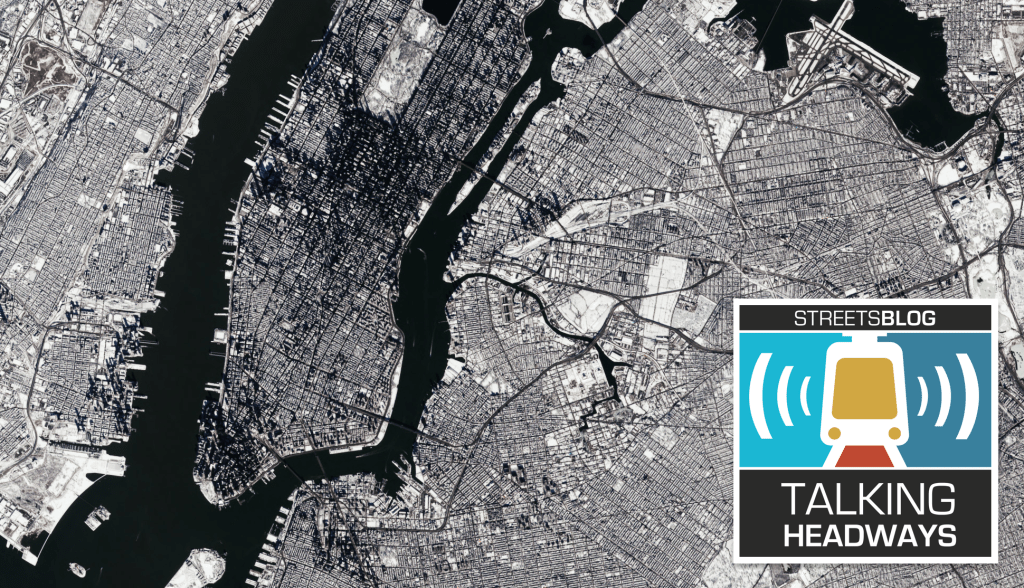
This week on the Talking Headways podcast, we’re joined by Karen Seto at Yale University and Zhe Zhu at the University of Connecticut to talk about their new study, The Urban Pulse. We talk about using granular satellite data to measure change in cities and the processes of urbanization.
Longtime listeners know the deal: Hit play on the audio player embedded below, read a full albeit AI-generated transcript here, or check out the edited excerpt at the end of this post.
Jeff Wood: How did you all collect the data, and how frequent was the pulse that you measured?
Zhe Zhu: It’s from Landsat and Sentinel-2. This data came from the NASA Harmonized Landsat Sentinel-2 data. It’s a NASA program that combines medium-resolution images into a 30-meter-by-30-meter resolution cell and removes all the sensor-to-sensor differences. It’s very good at detecting clouds and obtaining a clear observation.
About every three days, you’re going to get an observation based on how cloudy your locations are. And the data removes these atmospheric influences ands bi-directional differences when you view the same vantage point from different locations. The images are very consistent if there’s no change. When there’s change, we can see it based on this time series.
Jeff Wood: How do you see it? There’s so much data and information — how do you actually measure that change? You can see it if you look at one satellite image and another, but how do you systematize that so that you can actually, over time, collect this information?
Zhe Zhu: We built a time-series approach with two components. The first component is the code algorithm, which continuously monitors land disturbances. It basically drills through the time series. You can model what the surface will look like if nothing changes. Take the phenology of trees, which measures their seasonal life cycles. Phenology is going to have up and downs for different kind of conditions: the solar angle, the solar elevation, the topography, and so on.
The second component is where deep learning, machine learning comes in. We need to classify these breaks and the changes we observe. We need to make sure what is real: construction instead of deforestation or some other kind of non-construction related change. We use deep learning because the human patterns are very unique, so we need to combine the time series data and spatial pattern data in order to classify whether something is really a construction-related change instead of, for example, a fire or some other change that occurred on the land’s surface.
Karen Seto: One thing that is so novel about the methodology that Zhe developed is that it departs from the more conventional way of using satellite data, where you take the raw data and classify it into classes, right? Roads, buildings, agriculture — you do it to the next one, and the next one.
Zhe’s method takes the ostensibly raw data with minimal correction to see the signal, and then once there’s a change in the signal, you can say, “Oh, what is that class, given that there’s this big jump?” The methodology treats change as an inherent part of the signal.
Jeff Wood: When you looked into some of the changes, was there anything that was really interesting or jumped out at you? Like, maybe they’re building a subway in Shenzhen or they’re making these changes in Lagos? What are some of the things that popped out to you?
Karen Seto: Well, Zhe and I looked at the data for Dubai right after COVID, and we said, “Oh, this neighborhood in Dubai has no effect. There’s no COVID effect. There’s no drop in activity.” Whereas in other places in Dubai and in other parts of other cities, there was a clear drop. COVID happened, and there were shutdowns — but in this one neighborhood, everything stayed the same. So we, we did some research on that neighborhood, and it certainly corroborated what the data showed. It was surprising.
Jeff Wood: What was happening in that neighborhood? I’m curious.
Karen Seto: Continued development. People were still out and about.
Jeff Wood: Just going around, doing their thing.
Karen Seto: Yep.
Zhe Zhu: Yeah. And the spikiness of the urban development is also something I’m quite surprised about. I always thought of urbanization as something you do steadily, whether increasing or decreasing, but it is not. Lack of development can dominate for a few years, and then you get a big spike, and then nothing happens for a few years. We see that in a lot of places.

Read More:
Streetsblog has migrated to a new comment system. New commenters can register directly in the comments section of any article. Returning commenters: your previous comments and display name have been preserved, but you'll need to reclaim your account by clicking "Forgot your password?" on the sign-in form, entering your email, and following the verification link to set a new password — this is required because passwords could not be carried over during the migration. For questions, contact tips@streetsblog.org.