How Many Americans Live in Walkable Neighborhoods?

Editor’s note: a version of this article originally appeared on America Walks and is republished with permission.
A key objective of America Walks is to provide every American with the benefits of walkable communities. Which has led us to attempt to answer the question of who currently lives in walkable places, and who does not.
This new interactive walkability index is an attempt to answer that question and we invite you to explore it.
Why We Built This Walkability Index
Here is why we did it. First is to get our best understanding of current conditions with the hope of setting a baseline. Over time will a greater percentage of Americans get to live in walkable places? Or will more people be denied its benefits by autocentric land use policies? We hope to update this database as the underlying databases are updated.
Next, this approach highlights the importance of adding housing to walkable neighborhoods, not just making streets more walkable. Both approaches allow more people to live in places with activity friendly routes to the places they want to go. We believe walkability proponents should be advocates for better streets and better land use laws.
What the Data Shows
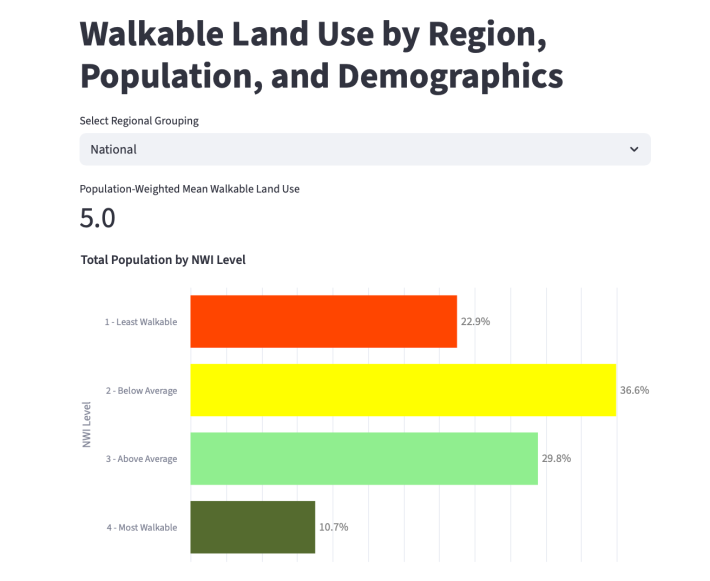
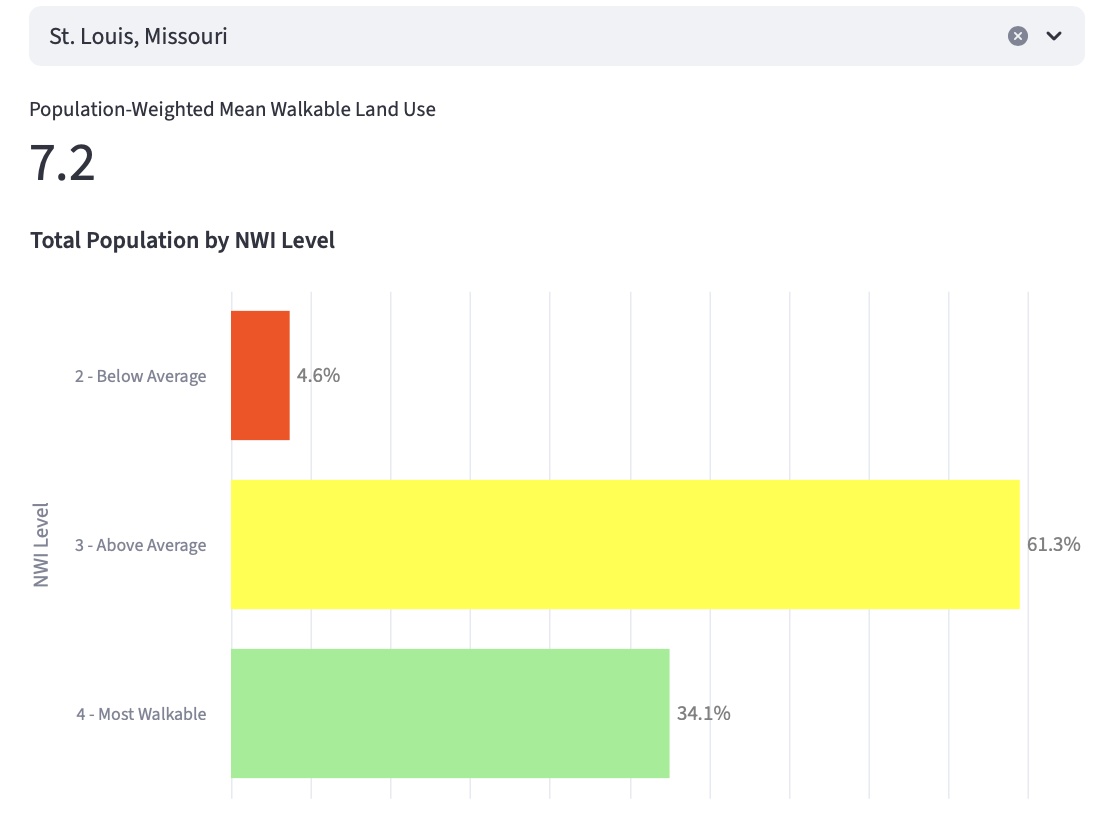
The data is also revealing. Relatively few residents get to live in the most walkable places, and a majority live in places rated below average or least walkable. The data also shows stark differences among different places.
Each geographical area (state, county, or city) has a number that measures walkable land uses weighted by population. We are not aware of any other walkability measure that attempts to answer how well states or cities are providing their overall population with walkable places.
By this analysis, the top five states are Rhode Island, California, Oregon, New Jersey and New York. Mississippi holds down the 50th spot, with West Virginia, Alabama, Arkansas and South Carolina above it in order. Go into the index, and find out how your state or city ranks.
How the Walkability Index Works
So how are these numbers determined? Let’s walk through the methodology. We took the EPA’s National Walkability Index – which ranks U.S. Census block groups according to their relative walkability – and cross referenced it with the American Community Survey, a U.S. Census survey that provides information on a yearly basis about our nation and its people.
We have to acknowledge up front that there are data limitations.
The EPA’s National Walkability Index is primarily based on measures of the built environment that affect whether people walk: street intersection density, proximity to transit stops, and diversity of land uses. Research demonstrates that people that live in such neighborhoods actually walk or roll more, and enjoy many of the benefits of active living. Due to current data limitation the National Walkability Index does not measure sidewalks, disability access, shade or street level amenities. For this reason we are calling this tool a “Walkable Land Use” analysis.
The “Population-Weighted Mean Walkable Land Use” found in our tables for each community is an extension of the data found in EPA’s National Walkability Index. That index measured the various walkable land use factors described above for every Census block group in the United States on a scale from 1-20. We averaged them, weighted them by the population of the block groups, and then converted it to a ten point scale to develop the average walkability index in our tables. A full explanation of EPA’s methodology is here.
We also must note that particularly dense cities (e.g. New York City) do not score particularly well. We believe that the algorithm in the EPA Walkability Index does not work as well where census block groups are geographically very small due to density. Such areas do not have the diversity of uses that yield a good walkability score, even though they are immediately next to a block group (like across the street) that has diverse uses. So that is a significant caveat. Such dense cities are outliers – we think the rankings work well for other cities.
We also acknowledge that you may choose to quarrel with how EPA’s Walkability Index characterizes your neighborhood. (Indeed, we encourage you to do so – where you live should be more walkable and we need better data!) But even so, this analysis does provide a standard basis to determine which places have “good land use bones” for walkability, and where we know, from data, that people actually walk more.
Why Better Walkability Data Matters
The limitations of the data should be a clarion call for more investment into research. America Walks supports efforts to fill in the data gaps to get a more comprehensive understanding of the neighborhoods with deficient infrastructure, as well as the factors that truly change residents’ behavior. We are grateful for the extraordinary work to date of researchers who have demonstrated the powerful interactions of land use with active living and health outcomes.
The database does not only look at geography, it also looks at age, race, ethnicity, income, education, homeownership and primary transportation mode. So in looking at a geographic region, one can get an analysis of the demographics of those living in more or less walkable places.
What do these deeper dives tell us? We encourage people to explore the database, and share what they find.

Read More:
Streetsblog has migrated to a new comment system. New commenters can register directly in the comments section of any article. Returning commenters: your previous comments and display name have been preserved, but you'll need to reclaim your account by clicking "Forgot your password?" on the sign-in form, entering your email, and following the verification link to set a new password — this is required because passwords could not be carried over during the migration. For questions, contact tips@streetsblog.org.