This article is part of the “Cycling Through COVID-19” series from world-renowned cycling researchers Ralph Buehler and John Pucher and is published with permission from the authors. In this series, we’ll explore how 14 large cities around the world adjusted their cycling policies during the first years of the COVID-19 pandemic, as well as how those policies contrasted with their approach in the decades prior. In each, Buehler and Pucher also explore how each city’s plans for future investment in cycling inLeffrastructure and programs have been impacted by the pandemic.
Read the rest of the articles in this series as they’re published here, or check out the full paper in Sustainability.
Austin
With about a million residents (2.2 million metro), Austin, Texas is the most pro-cycling large city in the American South. From 2010 to 2019, the city expanded its network of conventional on-street bicycle lanes from 134 kilometers to 473 kilometers.. In 2012, Austin installed its first protected bicycle lanes, following Dutch design guidelines. By 2019, there were 265 kilometers of protected on-road lanes, neighborhood bikeways (bicycle boulevards), and off-road urban trails, which the city considers its network of especially safe and low-stress cycling facilities for all ages and abilities. One focus of that network is serving short trips (up to five kilometers), which are largely found in the city center, where the bicycle mode share of trips is almost six percent.
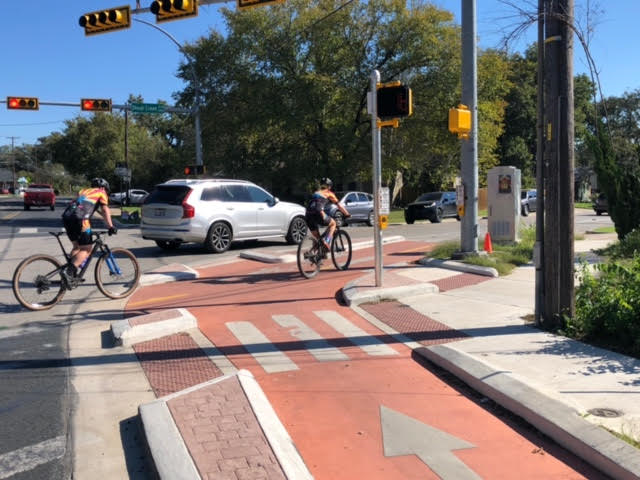
In 2020 and 2021, during COVID-19, Austin built 13 fully protected intersections (all four sides) and nine partially protected intersections (at least one side), increasing to 33 the number of such protected intersections in Austin. Such protected intersections force motor vehicles to make turns at lower speeds, increase the visibility of cyclists, provide shorter crossing distances for cyclists, and offer space for cyclists to wait for the green traffic signal to cross the intersection. From 2019 to the end of 2021, protected on-street lanes grew from 43 kilometers to 90 kilometers and the all-ages-and-abilities bicycle network grew from 265 kilometers to 358 kilometers, almost 100 additional kilometers in just two years. Conventional on-street bicycle lanes grew to 480 kilometers by the end of 2021, an increase of only five kilometers. As part of its package of COVID-19 measures, Austin also implemented 30 kilometers of slow and shared streets in 2020.
The large increase in protected cycling facilities is indicative of Austin’s planned future focus on expanding its low-stress, protected facilities for all, with only minimal growth planned for unprotected on-street lanes. As of March 2022, 260 kilometers of additional all-ages-and-abilities bicycle-network projects are planned through 2026, with a total network of more than 620 kilometers of such cycling facilities. At least 21 additional protected intersections are planned in the coming years, as the city engineers consider them an integral part of the expansion and improvement in protected bicycle lanes. Annual funding to expand protected facilities will roughly triple between 2020 and 2025, from three million to nine million dollars.
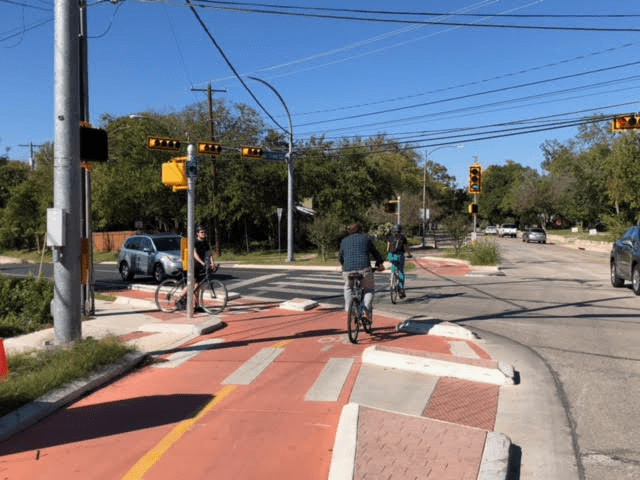
The results of Austin’s large investment in improved bicycle infrastructure have been impressive. The American Community Survey (ACS) of the US Census reports a 49 percent increase in daily bicycle commutes to work between the five-year average for 2006 to 2010 and the five-year average for 2016 to 2020, thus over a 10-year period. ACS uses five-year averages for its estimates to increase their accuracy. Eco-counter data from several locations in Austin show a 150 percent increase in bicycle trips (all trip purposes) between 2015 and 2019, and 18 percent further growth from 2019 to 2021 (during COVID-19).
In short, both Census ACS data and Eco-counter data confirm that Austin’s investment in expanded and improved cycling infrastructure has been very successful. That accomplishment is all the more impressive because Austin had been a typically low-density, car-oriented Texas city when the city’s cycling program began.
Portland, Ore.
With about 650,000 residents (2.5 million metro), Portland has been at the vanguard of cycling among large American cities. From 2000 to 2019, Portland quadrupled its daily number of bicycle commuters (from 4775 to 19,052) and increased the bicycle-mode share of work commuters from 1.8 percent to 5.2 percent.
The transformation of Portland into one of America’s top cycling cities was the result of several coordinated long-term pro-cycling policies. From 2000 to 2019, for example, the network of cycling facilities increased from 363 kilometers to 633 kilometers. The network included low-stress facilities for all ages and abilities: 56 kilometers of buffered bicycle lanes, 25 kilometers of physically separated, protected bicycle lanes, 162 kilometers of neighborhood greenways (bicycle boulevards), and 138 kilometers of off-road multi-use paths . The expanded neighborhood greenways were accompanied by slower speed limits for cars (30 km/h, or about 20 mph) and indirect routing for cars to discourage through car traffic in residential neighborhoods.
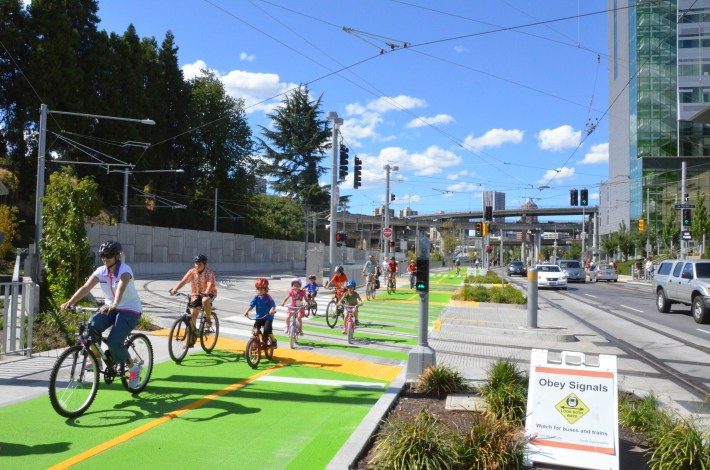
In addition, the supply of on-street bicycle parking was expanded, often through so-called bicycle corrals, which converted car parking spaces into bicycle parking spaces. The expanded and improved cycling infrastructure, combined with reduced speed limits in residential neighborhoods, greatly enhanced cycling safety. The 2019 cyclist injury rate — total injuries relative to total bicycle trips — was less than half the rate in 2000. Finally, the city launched Biketown in 2016, a Nike-sponsored bikesharing system with 1000 bicycles.
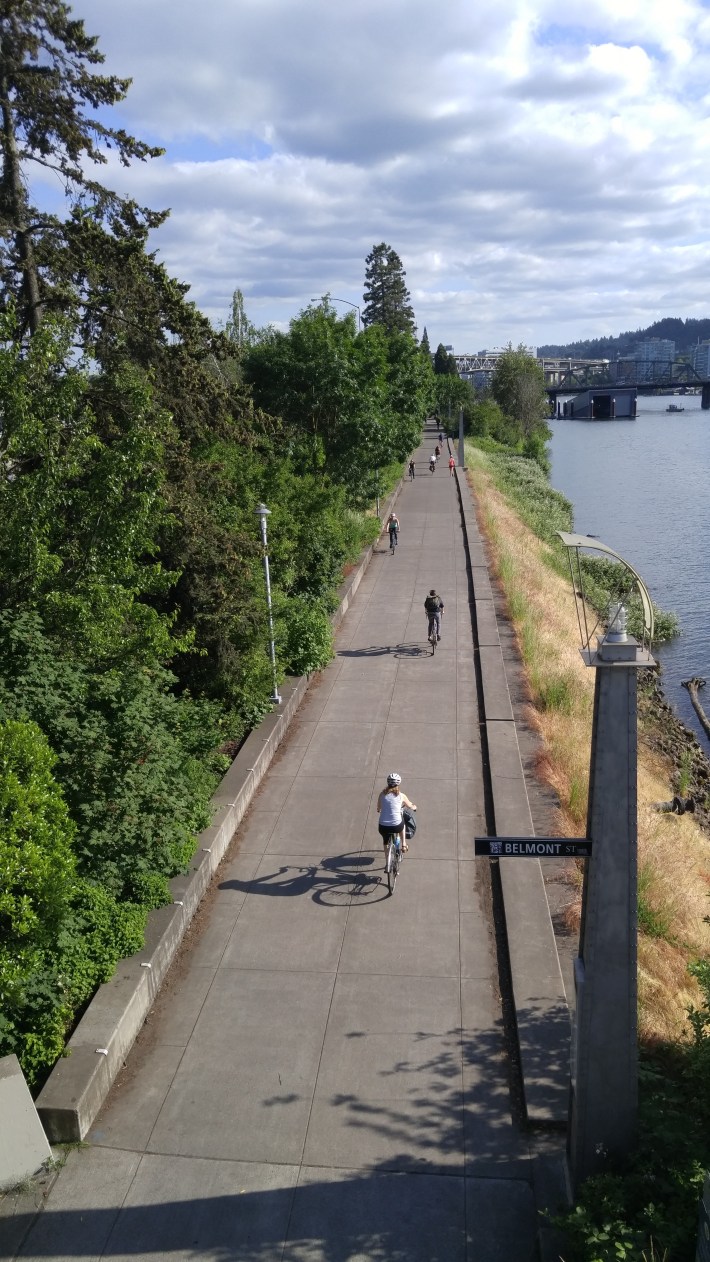
Cycling appears to have declined sharply during the COVID-19 pandemic, although it is difficult to obtain representative numbers. The only available data come from Ecocounters installed at the two busiest crossings for cyclists on bridges of the Willamette River. They report a 49 percent decline in bicycle trips from 2019 and 2021. The extensive closings of universities, schools, and businesses at various times, as well as shifts to remote working and learning, may help explain the especially sharp decline in bicycle crossings at those two bridges, as they are mainly used by daily bicycle commuters to work and university.
Portland did not undertake any special COVID-19-related pro-cycling measures but continued to pursue its ongoing efforts to expand and improve the bikeway network. From 2019 to early 2022, the city added another 20 kilometers to its bikeway network and plans to add another 125 kilometers in the coming three to four years. Those numbers, however, do not reflect the continuing qualitative improvement throughout the bikeway network, with many unprotected bicycle lanes being converted into either protected or buffered bicycle lanes, and with buffered bicycle lanes converted into protected bicycle lanes. Portland also continues its focus on intersection safety treatments to better protect cyclists when crossing. In addition, two new pedestrian–cyclist bridges facilitate crossings over two inner-city freeways.
Complementing those infrastructure improvements, Portland has been comprehensively reducing speed limits throughout the city, including the implementation of slow streets with speed limits varying from 25 km/h to 30 km/h (15 to 20 mph). Not only have cars been slowed down, but their space on roadways has been reduced, with many five-lane arterials reduced to three lanes for cars, providing space for protected bicycle lanes on both sides of the streets.
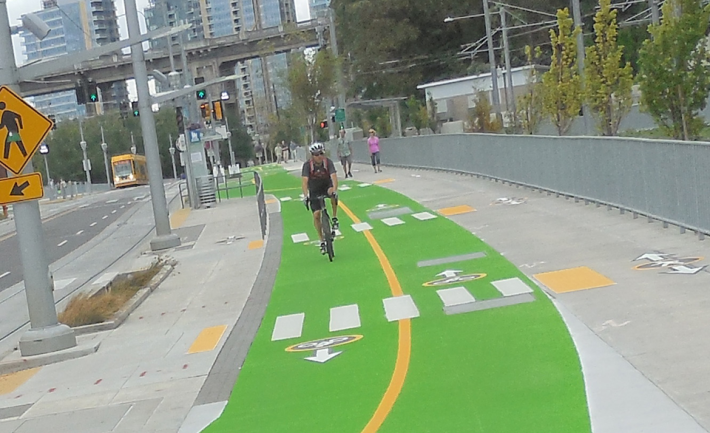
The area served by the 1000-bicycle Biketown bikesharing system was increased by 25 percent in early 2022, and all of the bicycles are now electric bicycles. Bicycle parking has been expanded and improved, reaching a total of 7444 city-managed bicycle racks (14,888 spaces) in early 2022. The city adds about 150 to 200 additional bicycle racks every year. The city also requires commercial and multi-unit residential buildings to provide minimum levels of bicycle parking.
In short, Portland has done virtually all the right things to make cycling safer, lower-stress, more convenient, and more feasible for all ages and abilities, including risk-averse and vulnerable persons. The city’s pro-cycling plans for the coming years would be even more effective if they were complemented by more car-restrictive measures such as reduced supply, increased price, and shortened duration of on-street parking—both in the city center and in outlying commercial areas. The city might also consider establishing car-free zones in parts of the city center.
Washington
Cycling has increased in Washington, DC (690,000 population) over the last two decades. The share of all trips made by bicycle increased five-fold, from about one percent in the late 1990s to five percent in 2018. Counts of bicyclists crossing bridges across the Potomac and Anacostia Rivers detected a 320 percent increase in cyclists between 2000 and 2018.
Data from the American Community Survey (five-year averages) of the US Census show that the number of daily bicycle commuters more than doubled between 2010 and 2020 and that the bicycle share of work commuters increased correspondingly, from 2.3 to 4.8 percent.. Facilitating that growth in cycling, Washington greatly expanded its bikeway network from only 5.1 kilometers of unprotected bicycle lanes in 2001 to 120.7 kilometers of regular, unprotected bicycle lanes, 19.3 kilometers of protected bicycle lanes, and 33.8 kilometers of shared bus-bicycle lanes in 2019.
During the COVID-19 pandemic, Washington reduced speed limits on 41.8 kilometers of neighborhood streets to 24 km/h (15 mph) and closed the streets to through traffic in a slow-streets program. Slower car travel speeds and lower volumes of car traffic made those streets more attractive and safer for cyclists. In addition, Washington reduced the general speed limit in the city to 32 km/h (20 mph) — unless otherwise posted. In contrast to other cities, Washington did not implement any pop-up bicycle lanes during COVID-19. However, the city continued to expand its network of bikeways, building 19.3 kilometers of protected bicycle lanes and 6.4 kilometers of regular bicycle lanes in 2020 and 2021 combined. The rate of construction of new bikeways was much higher in 2020 and 2021 compared to the years 2017 and 2019, when 4.8 kilometers were built each year.
Use of Washington’s bikesharing program, Capital Bikeshare (CaBi), declined sharply during the pandemic, with 38 percent fewer riders in 2020 compared to 2019. CaBi ridership was slightly higher in 2021 than in 2020, but still 25 percent lower than in 2019. Despite lower ridership, CaBi continued its physical expansion in Washington, adding 23 more docking stations and 600 e-bikes to its bicycle fleet. Counts of cyclists for 2020 and 2021 are only available for a trail along the Anacostia River in the eastern part of the city. The counts detect declines in cycling in 2020 compared to 2019 (?32 percent), but significant increases in 2021 compared to 2019 levels (+113 percent).
In the coming six years, Washington plans to spend $36M to build 96.6 kilometers of protected bicycle lanes to make crucial connections to close gaps in the city’s bikeway network. The city also plans improvements and upgrades for 33.8 kilometers of off-road trails in the city. Washington will expand CaBi over the next six years by investing $19M to add 80 stations and 3500 electric bicycles, which would more than double the number of bicycles in its bikesharing fleet. A recent regional survey indicated that 26 percent of respondents planned to cycle more after the pandemic than they did before 2020, suggesting a revival of the strong growth in cycling in Washington during the two decades prior to COVID-19.
