Cycling Through COVID-19: Montreal and Vancouver
This article is part of the “Cycling Through COVID-19” series from world-renowned cycling researchers Ralph Buehler and John Pucher and is published with permission from the authors. In this series, we’ll explore how 14 large cities around the world adjusted their cycling policies during the first years of the COVID-19 pandemic, as well as how those policies contrasted with their approach in the decades prior. In each, Buehler and Pucher also explore how each city’s plans for future investment in cycling infrastructure and programs have been impacted by the pandemic.
Read the rest of the articles in this series as they’re published here, or check out the full paper in Sustainability. This article has been edited slightly for clarity and length.
Montreal
Montréal has long been one of the top three cycling cities in Canada, together with Ottawa and Vancouver.
The Canadian Census reports an increase in the bicycle share of daily work commuters from 1.8 percent in 2001 to 3.9 percent in 2016 (the latest Census year available). The bicycle-mode share is much higher, however, in some central areas of the city, and bicycle counter data reveals almost a doubling in mid-winter cycling between 2015 and 2019.
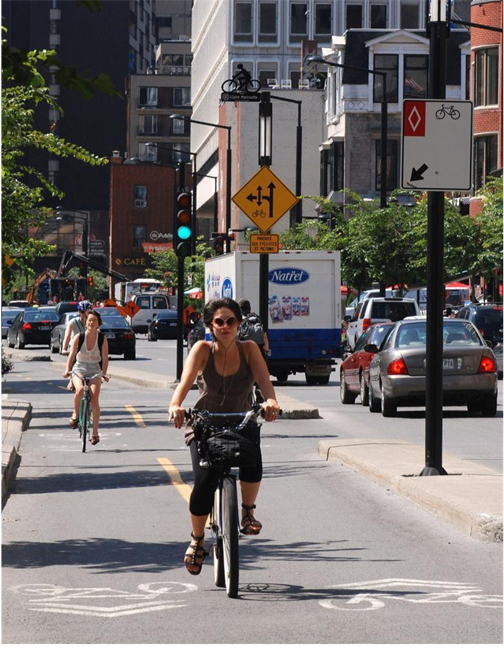
Montréal’s cycling successes are attributable to its many innovative pro-bicycle policies, some of which have been pathbreaking in North America. For example, Montréal was the first large city to develop an extensive network of physically separated on-street bicycle lanes (PBLs), most of which are bi-directional. The city started building PBLs in 1988 and gradually expanded them, with 82 kilometers by 2015 and 111 kilometers by 2019.
Other types of cycling infrastructure in Montréal also grew between 2015 and 2019. Conventional, unprotected on-street bicycle lanes (from 214 kilometers to 334 kilometers), lanes shared with motor vehicles on lightly traveled streets and 30 km/h speed limits (from 181 kilometers to 276 kilometers), and off-street bicycle paths and multi-use paths shared with pedestrians (from 271 kilometers to 287 kilometers). The total cycling network grew by 34 percent over this period, from 748 kilometers to 1001 kilometers.
In addition to being North America’s leader in PBLs, Montréal also introduced the first large-scale bikesharing system in 2009. Called BIXI, the system started off with 3000 bicycles and 300 stations and has since expanded to 7270 regular bicycles and 2395 e-bicycles (pedelecs) at 794 stations.
Automated bicycle counters in Montréal report a two percent increase in cycling volumes between 2019 and 2020 (the first year of COVID-19) but a decline of eight percent from 2020 to 2021. A special Quebec Ministry of Transport (QMOT) survey found that Montréal residents rode their bicycles as often in 2020 as in 2019, similar to the trends detected by bicycle counter data. The survey also found large differences in cycling impacts from 2019 to 2020 among different locations in the city, with increases averaging 12 percent at four locations but decreases averaging 38 percent at three locations. The increases were on recreational routes and in residential neighborhoods, while the decreases were on work and university commutation routes. The increases were on weekends, and the decreases mainly on weekdays. COVID-19 also had an important impact on BIXI bikesharing ridership. After having risen from 3.5 million trips in 2015 to 5.7 million trips in 2019, ridership plummeted to only 3.3 million in 2020, but then rebounded to 5.8 million in 2021.
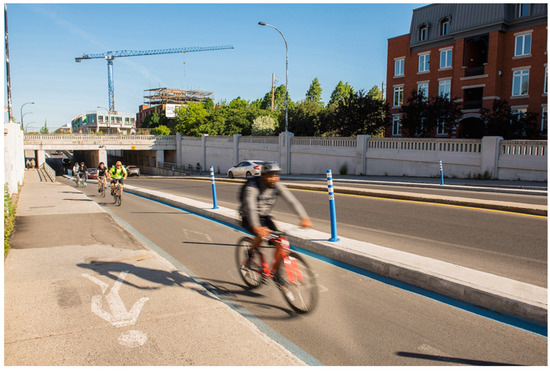
Montréal implemented many pro-cycling measures in 2020 and 2021.
Some of them were temporary, such as the 29 kilometers of bidirectional protected pop-up bicycle lanes installed for summer 2020 at the peak of the COVID-19 crisis in Montréal, the hardest hit of all Canadian cities. Those pop-up lanes were removed in the winter of 2020–2021, but some were re-installed as permanent protected bicycle lanes in summer 2021, sometimes converted from bi-directional pop-up lanes to one-directional PBLs—in opposite directions on both sides of the same streets.
PBLs expanded from 111 kilometers at the end of 2019 to 156 kilometers at the end of 2021, including 26 kilometers of extra-wide PBLs that are part of the new express bikeway network REV (Réseau Express Vélo). The city also expanded its network of vélorues (bicycle streets) from three kilometers to eight kilometers. Vélorues are comparable to Fahrradstrassen in Germany or Fietsstraaten in the Netherlands, where bicyclists have priority over motor vehicles for the entire width of the streets, which have speed limits of no more than 30 km/h.
The pro-cycling mayor Valerie Plante was re-elected in November 2021 by a margin of 14 points over her closest competitor, based in part on her commitment to further expanding and improving the cycling network in Montréal, especially protected bicycle lane. The new REV expressway network, for example, is scheduled to expand to 17 express bicycle routes and 184 kilometers of wide PBLs by 2027. The latest plans also call for a doubling in the overall bikeway network by 2027 (1815 kilometers). The City of Montréal has set a goal of increasing the bicycle mode share of trips to 15 percent in central boroughs. Given that commitment to massive investment in cycling infrastructure, it seems certain that cycling will grow significantly in the coming years, reinforcing Montréal’s decades-long reputation as a leading cycling city in North America.
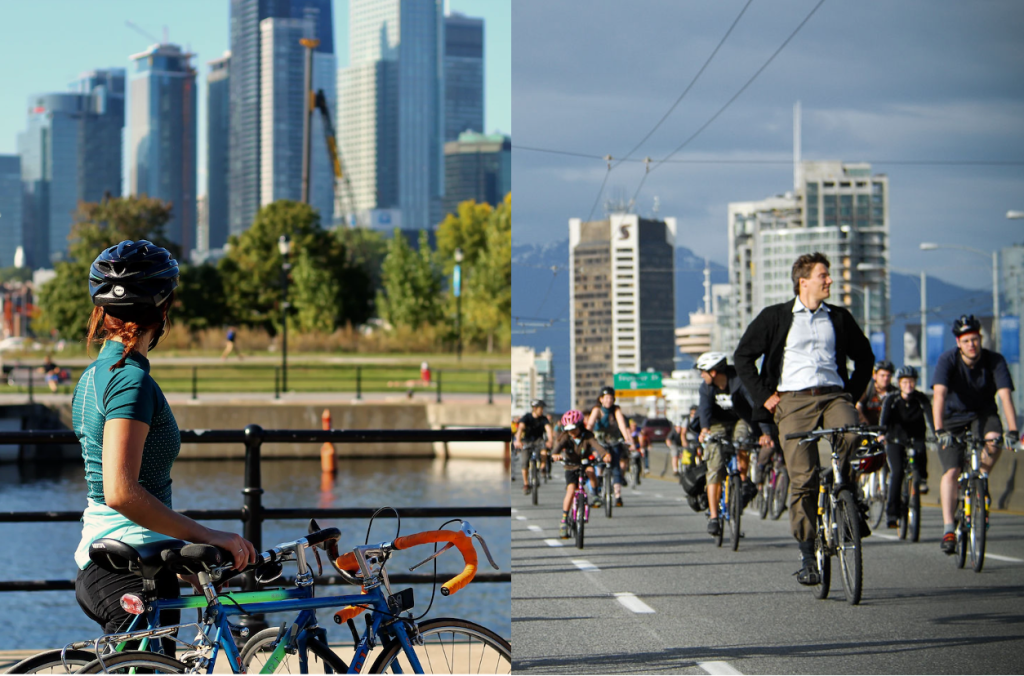
Vancouver
With 660,000 residents (2.6 million metro), Vancouver is one of Canada’s leading cycling cities. City travel surveys report a doubling in the cycling share of trips (all trip purposes) from 4.4 percent in 2013 to 8.8 percent in 2019, the year just before COVID-19. The Canadian Census also reports a large increase in cycling in Vancouver, with total daily bicycle commuters increasing from 3.7 percent in 2006 to 6.1 percent in 2016, the latest Census data available..
Since 2000, Vancouver has greatly increased the extent and quality of its bikeway network. Especially since 2010, the city has focused on expanding and improving cycling facilities “for all ages and abilities,” corresponding to the stated goal of the city’s latest bicycle plan. From 2010 to 2019, off-street bicycle paths grew from 59 kilometers to 73 kilometers; physically separated, protected on-street bicycle lanes grew from 16 kilometers to 24 kilometers; and local street bikeways grew from 125 kilometers to 172 kilometers. In 2019, these three kinds of facilities together provided a network of 269 kilometers of safe, convenient, and low-stress cycling facilities intended to attract a broad spectrum of Vancouverites to ride a bicycle.
The COVID-19 pandemic provided further impetus for expansion and improvement to the bikeway network.
For example, five kilometers of local-street bikeways were added to the city’s bikeway network in 2020 and 2021 (reaching a total of 176 kilometers), and two kilometers were added to the city’s system of protected on-street bicycle lanes (reaching a total of 26 kilometers). Several innovative measures were also introduced during COVID-19, some of which are being made permanent. For example, the city installed many pop-up bicycle lanes, such as a two-kilometer stretch of Beach Avenue that has since been converted into a permanent protected bicycle lane, separated from motor vehicle traffic with concrete barriers. That upgrade has attracted the most bicycle traffic of any city facility, with almost 14,000 cyclists on some days. In addition, over 40 kilometers of local streets were officially designated as slow streets, with speed limits of 30 km/hr. Streets near schools and parks also have 30 km/h speed limits.
Another COVID-19 experiment was the implementation of car-free streets adjacent to three schools during school hours, a program that will be expanded to more schools in the coming years. The City of Vancouver greatly expanded its cycling education program, which is delivered in partnership with the local school board and HUB Cycling, a local advocacy organization. Free cycling courses are now available to all 6th and 7th grade students in public schools. City-supported cycling promotion and events also increased. The Bike-to-Shop program, for example, provided discounts and free gifts for customers arriving by bicycle.
Eco-counter data indicate almost no change in total bicycle trips in Vancouver between 2019 and 2020 (1.37 m vs. 1.34 m trips). The City of Vancouver reports increases on recreational routes, especially on weekends, and decreases in cycling on commutation routes during weekday rush hours, but those two opposing trends appear to have canceled each other out.
More improvements are scheduled in the coming years. The city’s already extensive networks of local-street bikeways and protected bicycle paths will be further expanded, including the conversion of some of the pop-up lanes into permanent protected lanes. The slow-streets program will be expanded into a slow-neighborhood-zone program (mostly 30 km/h) covering entire neighborhoods instead of individual streets, similar to the low traffic neighborhoods in Greater London.
Some key cycling connections will also be improved. For example, the eight-lane Granville Connector Bridge will be reduced to six lanes for cars, with the freed-up roadway space used for wide protected bicycle lanes and sidewalks on both sides of the bridge. This ‘connector’ will address a major gap in the city’s active transport infrastructure, linking with greenways and protected facilities on either side of False Creek.
Finally, the region’s transport agency, Translink, will be working with Vancouver and other local governments in the Metro Vancouver region to deliver an 850 kilometer major bikeway network to better connect communities across the region and implement complete, connected bikeway networks for each of the region’s 26 designated urban centers.
Editor’s note: This story has been updated to clarify the margin by which Valerie Plante won her recent election.

Read More:
Streetsblog has migrated to a new comment system. New commenters can register directly in the comments section of any article. Returning commenters: your previous comments and display name have been preserved, but you'll need to reclaim your account by clicking "Forgot your password?" on the sign-in form, entering your email, and following the verification link to set a new password — this is required because passwords could not be carried over during the migration. For questions, contact tips@streetsblog.org.

