Editor's note: This article is part of the “Cycling Through COVID-19” series from world-renowned cycling researchers Ralph Buehler and John Pucher and is published with permission from the authors. In this series, we’ll explore how 14 large cities around the world adjusted their cycling policies during the first years of the COVID-19 pandemic, as well as how those policies contrasted with their approach in the decades prior. In each, Buehler and Pucher also explore how each city’s plans for future investment in cycling infrastructure and programs have been impacted by the pandemic.
Read the rest of the articles in this series as they’re published here, or check out the full article in Sustainability.
The COVID-19 pandemic brought about the most rapid transformation of the streetscape in Greater London in recent decades, resulting in a sharp rise in both walking and cycling. The UK Department of Transport estimates that total cycling distance traveled increased by 46 percent in Greater London in 2020 (compared to 2019). Transport for London (TfL) reported a 22 percent increase in bicycle trips in Outer London and a seven percent increase in Inner London. On some weekends in 2021, cycling levels rose by more than 200 percent.
In the decade prior to the COVID-19 pandemic, Greater London more than tripled the length of protected on-street bicycle lanes from 50 kilometers to 162 kilometers. In the 12 months after the outbreak of COVID-19 in London, the city built 100 kilometers of additional protected bicycle lanes, yielding 260 kilometers of protected bicycle lanes by March 2021. Most new bicycle lanes installed during COVID-19 were created rapidly using plastic wands (flexposts) to separate cyclists from motor traffic. It is expected that more permanent barriers will be installed on most of the new bicycle lanes in the coming years, along with further expansion of the protected bikeway network.
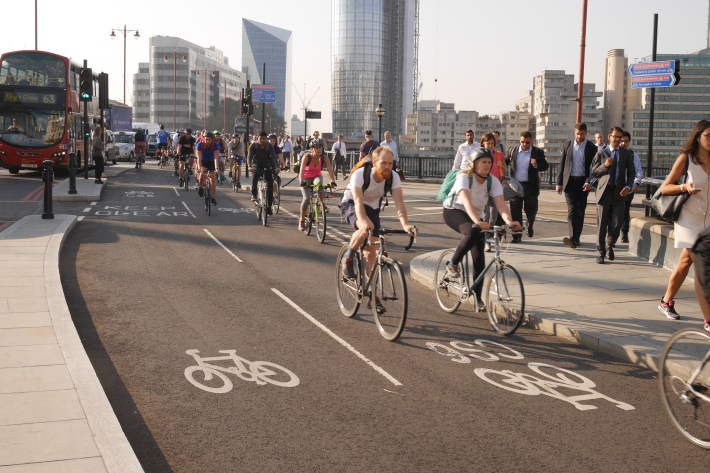
TfL data show that where new protected bicycle lanes were installed, cycling levels increased by up to 70 percent. The percentage of the Greater-London population living within 400 meters of the high-quality cycle network increased from 12 percent in 2019 (prior to COVID-19) to 19 percent in December 2021. The accessibility to protected bicycle lanes is projected to rise to 35 percent by 2025, requiring an increase in the network of protected cycling facilities to more than 400 km.
In short, the extent of the protected bikeway network in Greater London is planned to expand dramatically by 2025, partly stimulated by the special incentives during the COVID-19 pandemic. Over the longer term, Greater London’s Strategic Cycling Plan aims for 70 percent of the population to live within 400 kilometers of a high-quality bikeway by 2041.
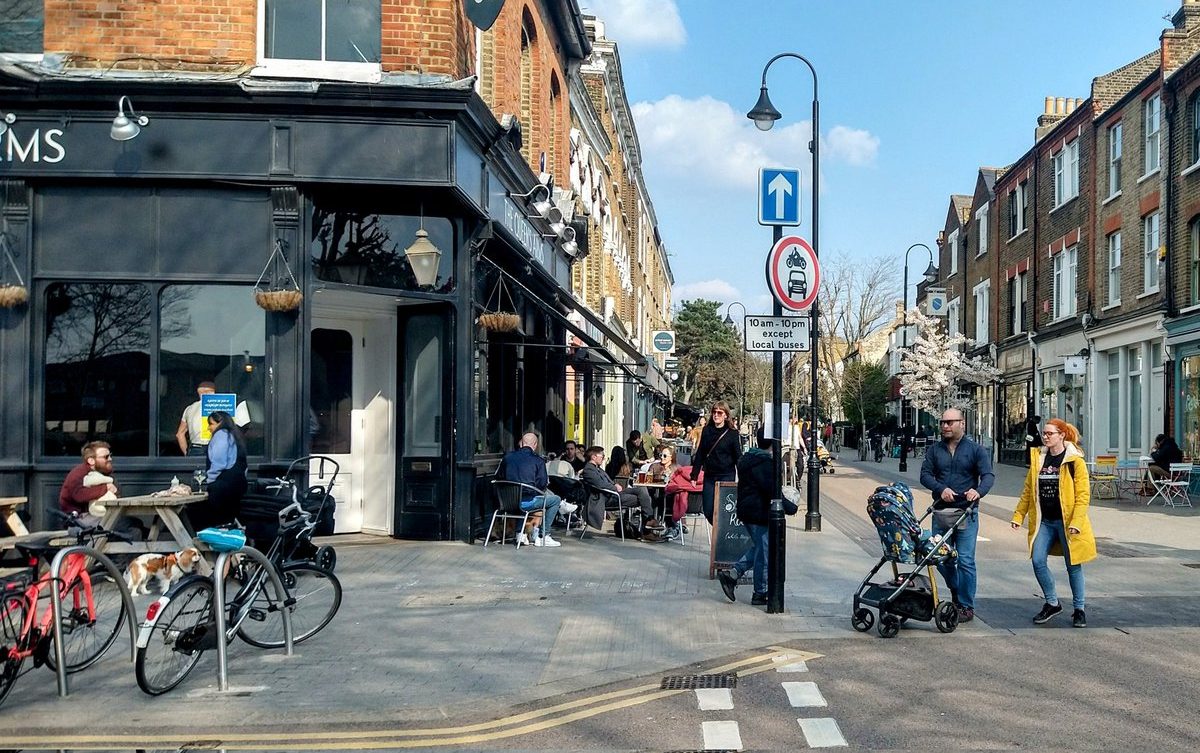
A second and equally important development has been the rapid implementation of almost a hundred so-called low-traffic neighborhoods, or LTNs, across many London boroughs. Most LTNs are located in Inner London, where the default speed limit is 20 miles per hour in residential areas. LTNs use a combination of bollards, large wooden planters, and enforcement cameras to reduce speeds and to prevent motor traffic cutting through entire residential areas.
Data collected for academic surveys and local government agencies show significant increases in walking and cycling, decreases in car use, and reductions in injury rates for pedestrians and cyclists, especially among children. The program has helped address the rapid rise in through traffic on narrow residential streets, which almost doubled over the past decade, facilitated by navigation apps such as Waze and Google.
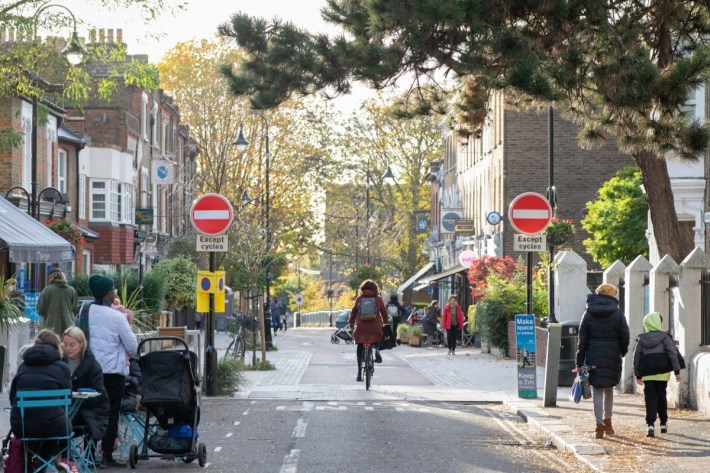
A third element of London’s transformation has been the School Streets program, which excludes all but residential traffic from streets surrounding schools at drop-off and pick up times. More than 500 School Streets are already in place and many more are in the process of being installed. School cycle- and scooter-parking zones have frequently been filled up following the establishment of School Streets.
As in most of the case-study cities we examine in this series, Greater London’s expansion of its protected bikeway network, implementation of LTNs, and the School Streets program had already been begun prior to COVID-19, including plans for future expansion. Yet COVID-19 provided an important stimulus to speed things up due to increased public and political support.
