Three of the nation's poorest cities are actually the most expensive places to live — when you factor in how much it costs to get around, and not how much it costs to pay the rent.
That's the takeaway from a new report from the Citizens Budget Commission that looked at median combined housing and transportation costs as a percentage of area median income, instead of housing costs alone. When it comes to that expanded affordability metric, transit-rich, but housing-dear New York City actually ranks as the eighth most affordable metro among 20 peer cities. The Center for Neighborhood Technology says spending 45 percent of your household income on housing and transportation combined is a good rule of thumb; New Yorkers are paying just a touch more, at 45.3 percent.
Meanwhile, three of the nation's most car-dependent cities fall to the bottom of the list: Miami, Detroit and Phoenix.
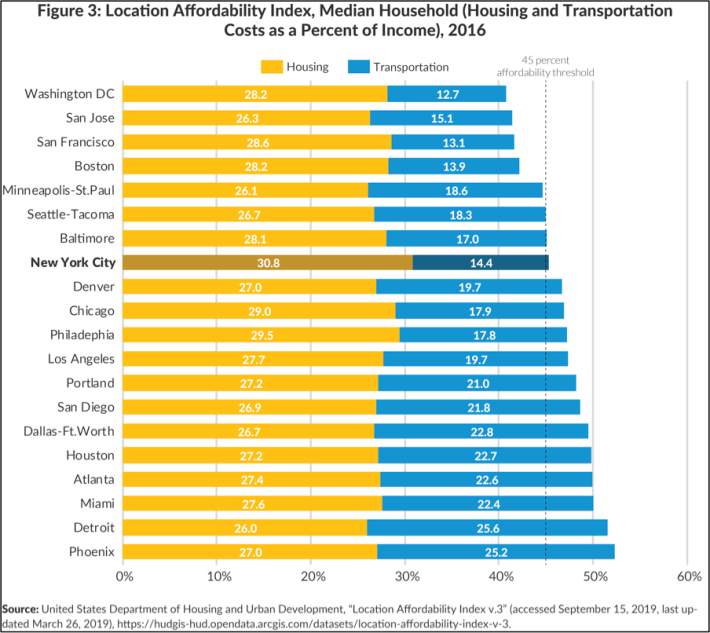
Source: CBC.
The Citizens Budget Commission is not the only group pointing out that transportation costs deserve a bigger place in our conversations about making our cities more affordable to more Americans. The H+T Index has been mapping the metric since way back in 2006. Their site is a treasure trove of fact sheets about what it costs to live and get around in communities across America — and according to their data, not many places are doing much better than Phoenix and Detroit.
In this map, the yellow spots indicate a region where median combined housing and transportation costs are 45 percent of the median income, or less. All the dark blue swaths represent communities where they're more.
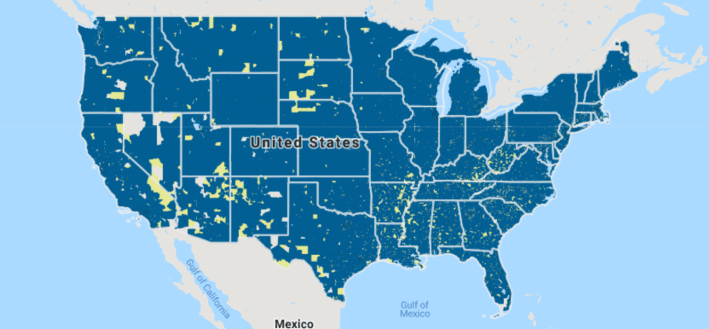
If you consider only the cost of housing without transportation costs, by contrast, most of America meets the 30 percent affordability threshold accepted by most housing advocates, at least on a birds-eye view. In this map, yellow represents places where the average Joe can afford his rent; blue zones are where the average Jane is struggling to pay the landlord.
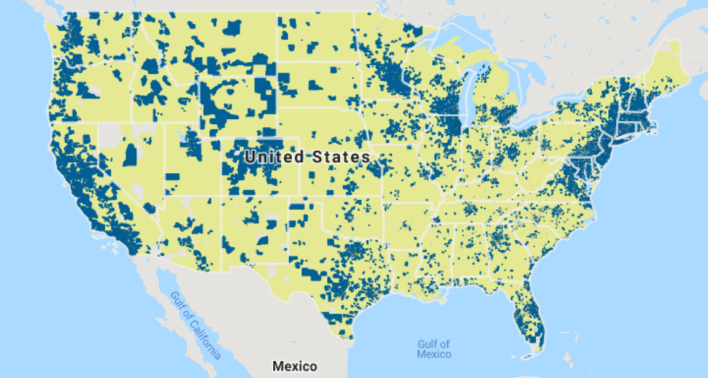
(By the way: if you're in the mood to waste some time today, the "fact sheets" tab of the H+T index allows you to zero in on which places make the affordability grade, simply by entering a ZIP code, city name, or state. Just in case you were looking for a reason to never move to Wyoming.)
And before you ask, no: the cities at the bottom of the list do not have secret expensive-yet-well-used public transportation systems.
The top city on CBC's list, Washington, DC, also has the third highest rate of transit ridership, with 37.4 percent of Washingtonians using public transportation; only about 4 percent of Phoenicians do, and that helps land the Arizona capital at the bottom of the rankings. A one-day unlimited pass in the nation's capital will run you $13; in Phoenix, it's just $6.50. It's not hard to extrapolate that the Americans who pay the most for transportation are often doing so because they're driving — and they're often driving because the autocentric development pattern of the cities where they live functionally forces them to get behind the wheel if they want to make it to work.
If we truly want to reckon with our national poverty crisis, we don't just have to build more affordable apartment rentals. We also have to take a hard look at what it will take to make going car-lite or car-free a feasible possibility for more people — or else we might leave a lot of low-income Americans behind.


