Where Car Commuting Is Shrinking — And Where It’s Not
Where are Americans making the shift away from driving to work?
Crunching newly-released Census data, Yonah Freemark looked at how commute travel is changing in different cities and regions. In general, car commuting in major metro areas declined between 2005 and 2015, but the shift was greater than a couple of percentage points in only a few cities.
Keep in mind that commuting accounts for less than 20 percent of all trips, so these numbers may not reflect trends in other kinds of trips. Annual Census estimates also have fairly high margins of error, so any shifts that aren't very significant in size should be taken with a grain of salt.
Here are the tables that Freemark compiled.
The share of people driving to work dropped in most major metro areas
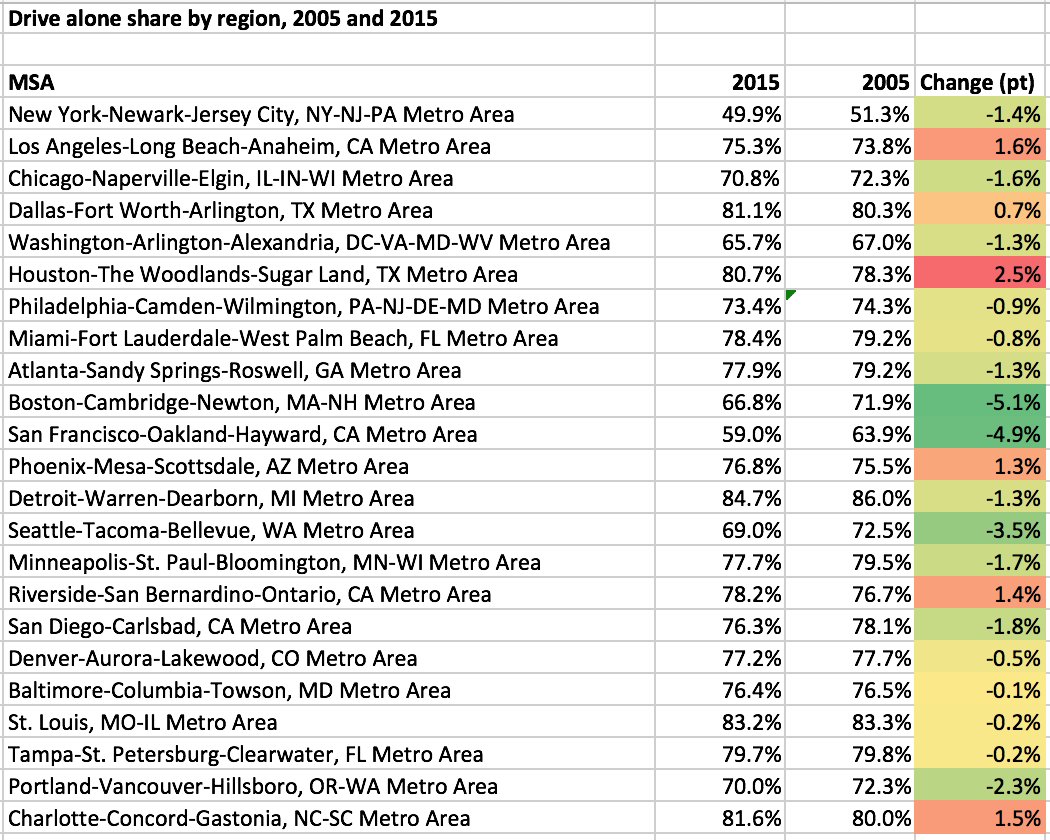
The standouts here are greater Boston, San Francisco, and Seattle. Meanwhile, the share of car commuters increased in greater Houston, L.A., and Charlotte. It's worth nothing that both Houston and L.A. made significant investments in rail infrastructure over the last decade. But apparently that wasn't enough on its own to shift commuting patterns.
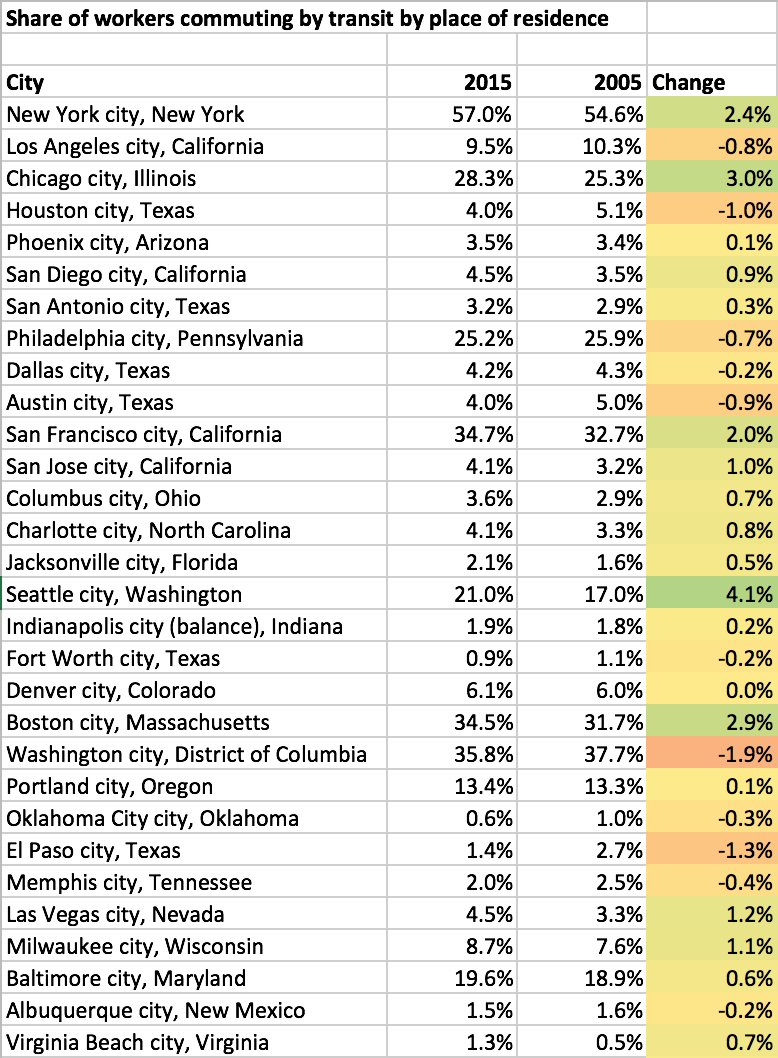
Transit commuting is increasing in most places, but not by much
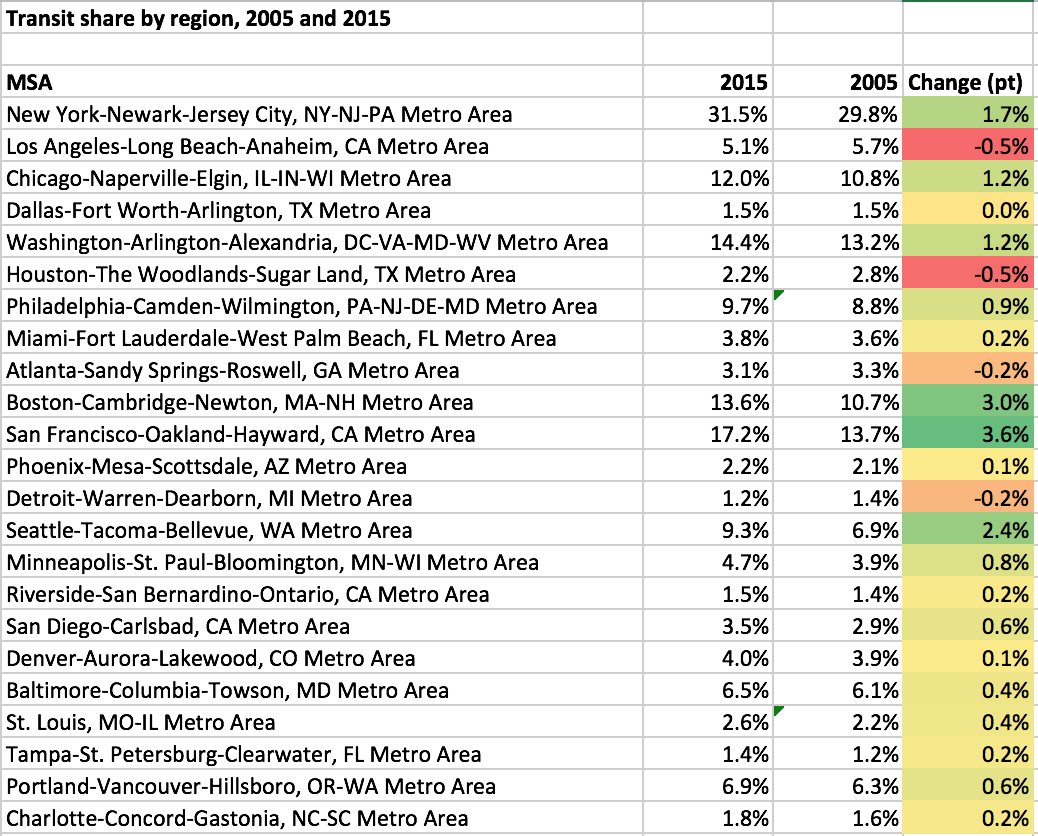
There are more gainers than losers in this table, but again only the Boston, San Francisco, and Seattle regions increased transit commuting by more than 2 percentage points.
Looking at cities, not regions, Seattle is a real standout in reducing car commutes
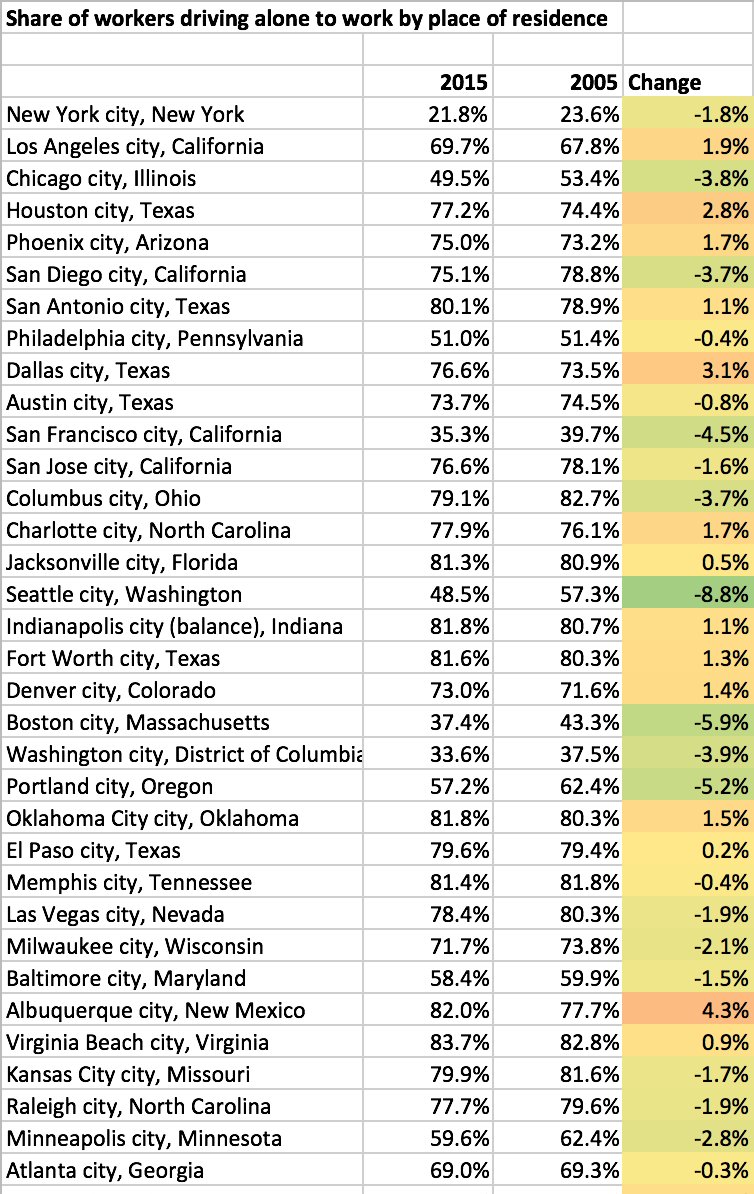
The nearly 9 percentage point drop in car commuting in Seattle is impressive. Nowhere else really comes close.
On the other end of the spectrum, Sun Belt cities and Texas cities stand out as the worst performers.
Washington Metro's troubles show up in DC's transit commute rate
The worst performer here isn't a Sun Belt city, but Washington, D.C. -- where WMATA's management of the transit system has led to serious safety problems and the agency is currently preparing to make drastic cuts in late night service.
In another surprise, Las Vegas notched a respectable increase.
Overall, these Census commute numbers suggest that while you need good transit service if you want more people to take the bus or the train to work, building transit capacity isn't sufficient, on its own, to increase transit commuting. Other factors like land use, the safety of walking and biking, and the expansion or shrinkage of car infrastructure have to be taken into account.
Stay in touch
Sign up for our free newsletter
More from Streetsblog USA
Thursday’s Headlines Are Down on Highways
Two outlets recently featured articles on the harmful effects of ongoing freeway projects.
Talking Headways Podcast: Details of Development Reform in Minnesota, Part I
Jim Kumon of Electric Housing discusses his work as a developer and urban policy educator in the Twin Cities.

Thursday’s Headlines Don’t Like Riding on the Passenger Side
Can you take me to the store, and then the bank? I've got five dollars you can put in the tank.

Study: When Speed Limits Rise on Interstates, So Do Crash Hot Spots on Nearby Roads
Rising interstate speeds don't just make roads deadlier for people who drive on them — and local decision makers need to be prepared.

Calif. Bill to Require Speed Control in Vehicles Goes Limp
Also passed yesterday were S.B 961, the Complete Streets bill, a bill on Bay Area transit funding, and a prohibition on state funding for Class III bikeways.