A New Resource for Tracking Transit Trends in American Cities
How does transit ridership in your city stack up against other cities? A new tool from transit analyst extraordinaire Yonah Freemark at the Transport Politic can help you figure it out.
3:47 PM EDT on September 9, 2016
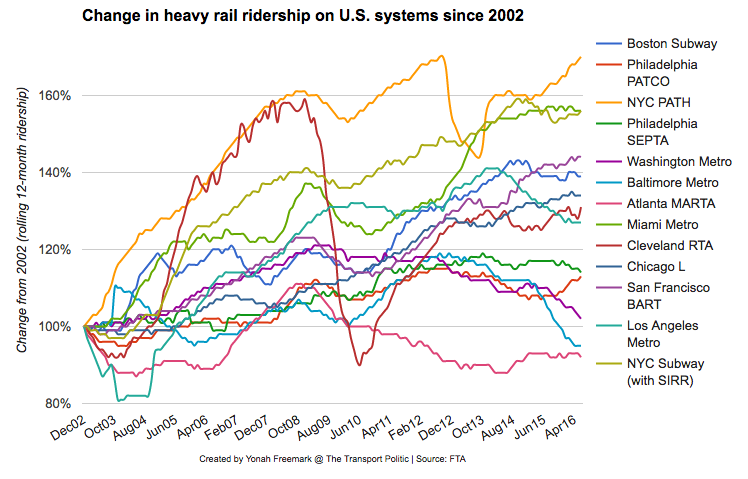
How does transit ridership in your city stack up against other cities? A new tool from transit analyst extraordinaire Yonah Freemark at the Transport Politic can help you figure it out.
Freemark’s “databook” compiles a raft of data from the Census and the Federal Transit Administration into a series of graphs and tables that show trends in transit ridership in selected U.S. cities. Here you can see how bus ridership is floundering in many American cities (but not Seattle):
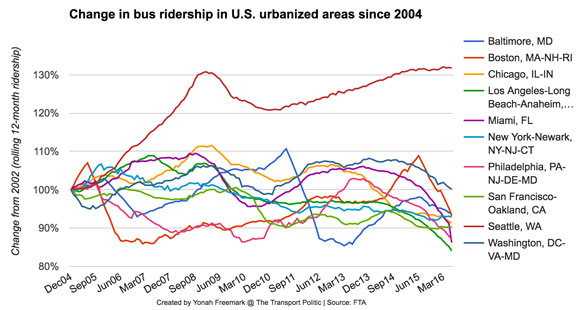
Be sure to check out the site itself, which has several more charts and tables.

Angie is a Cleveland-based writer with a background in planning and newspaper reporting. She has been writing about cities for Streetsblog for six years.
Read More:
More from Streetsblog USA
Petitions Push Democrats to Ditch Dangerous New Transportation Bill
House Democrats' incoming top transportation leader is already throwing cold water on calls for the party to deliver a better transportation bill.

November 18, 2026

Wednesday’s Headlines Take the Off-Ramp
Another sign that autonomous vehicles are not ready for prime time.

November 18, 2026
Op/Ed: Finally, a Medical Doctor Who Knows the Difference Between E-Bikes and E-Motos…and Why It Matters
Even outside politics, Election Day, November 3, brought some welcome news: an insightful article in TIME magazine despite its dubious headline.

November 17, 2026

Opinion: France Did E-Bike Subsidies Right — and America Can, Too
America is subsidizing the wrong kind of mobility. Could France's e-bike rebate program serve as a better model?

November 17, 2026

London’s Car-Free Oxford Offers Lessons for One of America’s Most Iconic Streets
The holiday season approacheth, Mayor Mamdani.

November 17, 2026