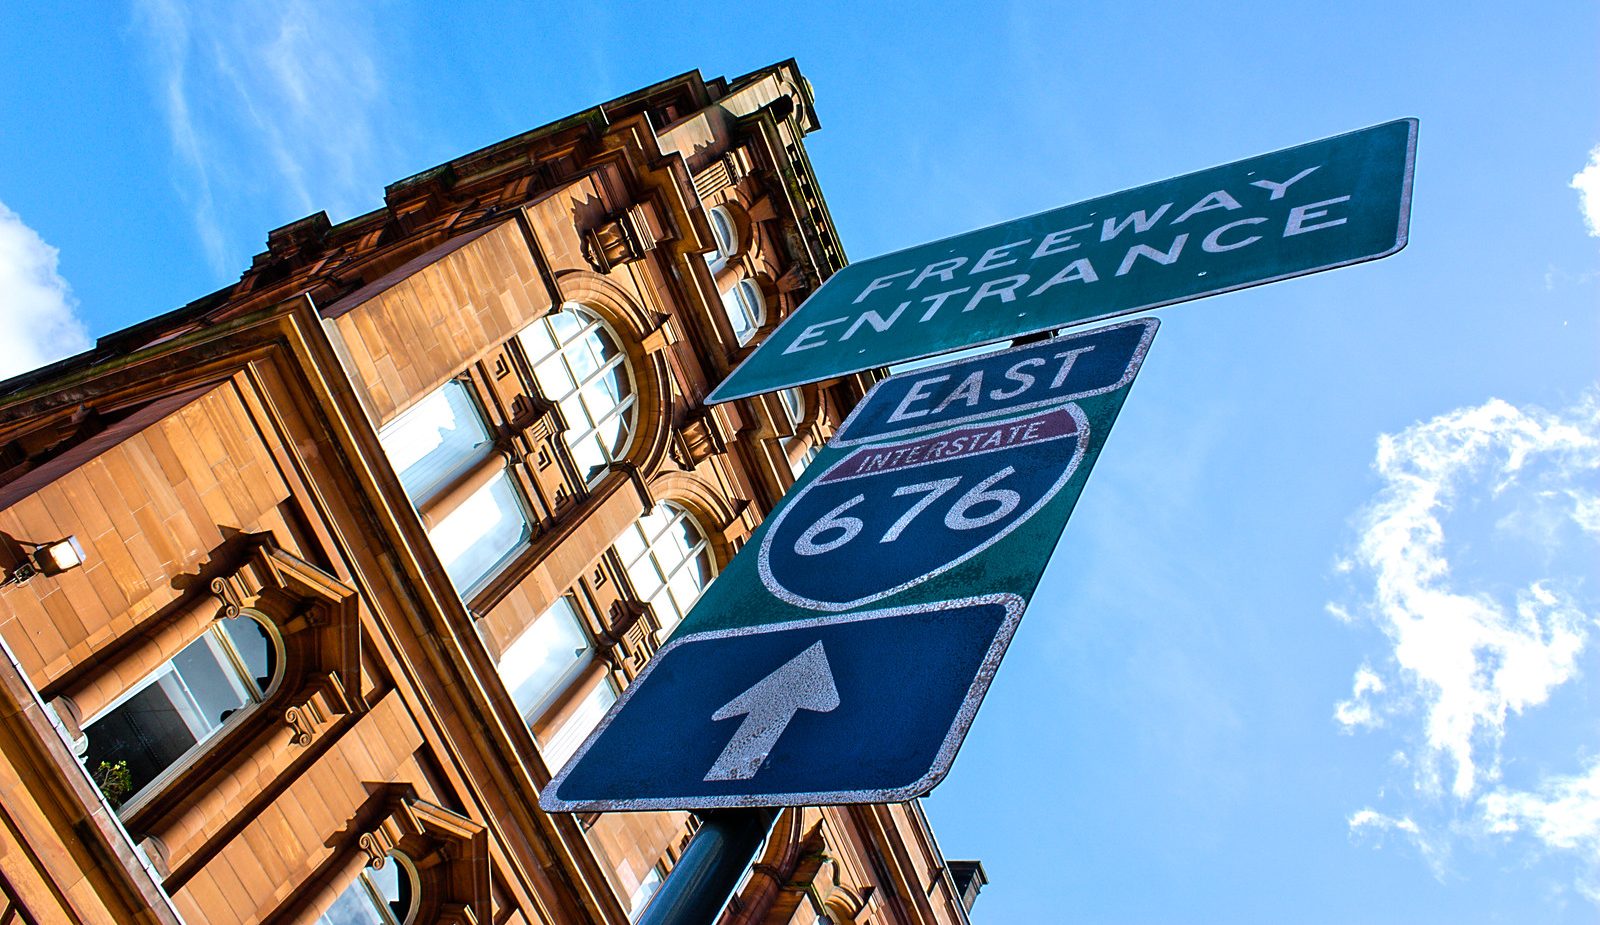
A Better Way to Track How Well Transit Performs

When you're riding the bus or the train, an unexpected delay is the last thing you need. If transit agencies want to know how well they're doing and how they can improve service, they have to track how reliable their service is for riders.
But not all reliability metrics are created equal, writes TransitCenter. Some agencies track their performance in a way that's much less rider-friendly than others:
At the moment, the [New York] MTA and many other agencies tend to use indicators of success that reflect the concerns of the people who actually run subway or other systems. These include on-time performance and the average distance a train car travels between mechanical problems.
But those measurements might not actually indicate whether the agency is delivering good service to riders. For example, regarding subway delay, the MTA relies heavily on a performance metric known as “wait assessment,” defined as the percentage of train arrivals that cause passengers to wait at least 25 percent longer than expected.
Wait assessment has two major problems. First, it is not obvious what it means to have a “good” wait assessment score. If the A train has a wait assessment score of 85 percent, what does that mean for riders? Second, wait assessment is indifferent to how late a train is or how many riders are affected by its lateness. On a line with service every four minutes, a gap of six minutes between trains in the Bronx at 6 A.M. is equally as “bad” as a gap of 15 minutes between trains passing through Grand Central at rush hour.
TransitCenter says Boston's MBTA has adopted a metric more in line with international best practice, one that captures what matters to riders:
There is already a performance metric that does a much better job than wait assessment. It’s called excess wait time, or EWT for short.
EWT measures how much extra time passengers wait for a train or bus compared with the ideal scenario of every vehicle running at scheduled frequencies. This gives it major advantages over wait assessment.
For starters, EWT records delay in minutes rather than as a percentage, which captures the problem of delay for riders much more accurately and intuitively. As a result, long gaps in service that cause big rider delays are weighted more heavily than small delays. Additionally, EWT weights delay by the number of people affected, so a service problem during rush hour counts as a bigger negative than an equivalent service delay on Sunday morning.
Not only has Boston moved toward a more rider-centric metric, it's working on publishing the data in an open format. TransitCenter has supported the development of a data tool to assess the reliability of New York City's bus routes based on the EWT standard. The more agencies that collect this data, release it an open format, and use it to improve service, the better.
Elsewhere on the Network today: Greater Greater Washington reports the extension of the D.C. Streetcar may have dedicated lanes -- addressing a key shortcoming of the existing project. Bike Portland notes that drive-alone rates are falling in greater Portland, even in suburban areas. And The Political Environment considers whether Great Lakes states outside of Wisconsin will use their authority to stop a plan divert Lake Michigan water to a sprawling Milwaukee suburb.
Stay in touch
Sign up for our free newsletter
More from Streetsblog USA
Thursday’s Headlines Are Down on Highways
Two outlets recently featured articles on the harmful effects of ongoing freeway projects.
Commentary: There is Zero Ambiguity to the West Portal Tragedy
What happened in West Portal was entirely predictable and preventable. The city must now close Ulloa to through traffic and make sure it can never happen again.
Talking Headways Podcast: Details of Development Reform in Minnesota, Part I
Jim Kumon of Electric Housing discusses his work as a developer and urban policy educator in the Twin Cities.

Thursday’s Headlines Don’t Like Riding on the Passenger Side
Can you take me to the store, and then the bank? I've got five dollars you can put in the tank.

Study: When Speed Limits Rise on Interstates, So Do Crash Hot Spots on Nearby Roads
Rising interstate speeds don't just make roads deadlier for people who drive on them — and local decision makers need to be prepared.