What Can an Algorithm Tell Us About How People Perceive Streets?

What makes people feel that a street is safe, and what do those perceptions tell us about different streets? A group of researchers at MIT have developed a formula designed to approximate people’s subjective reactions to the way streets look. They hope it will help chart shifts in the quality of city environments over time and prove useful to urban planners and architects seeking to better understand what makes streets appealing.
Based on survey responses from almost 8,000 people, the research team developed an algorithm they are using to rank the perceived safety of every streetscape image provided by Google Maps in New York, Boston, Chicago and Detroit. Using the algorithm enables the MIT researchers to rate many more streets than if they had relied on human surveys. They hope to eventually make maps like the one above available in every city in the Northeast and Midwest. They call the tool Streetscore.
The MIT team says their algorithm is a reliable mimic of how humans perceive visual cues in urban environments. Using a 1 to 10 scale, 84 percent of the time it can successfully predict whether real people will rate a street on the low end (less than 4.5) or the high end (more than 5.5). The factors incorporated by the algorithm are not public at this time.
The perception of “safety” that Streetscore approximates is defined vaguely, since the survey doesn’t explicitly distinguish between traffic violence and violent crime. But the researchers say they have found a correlation between homicide rates and Streetscore ratings in New York. Meanwhile, a look at the New York City map reveals that some streets with high rates of traffic injuries and fatalities, like Queens Boulevard, rate poorly, while others, like the leafier Ocean Parkway in Brooklyn, rate well. Industrial zones and streets under elevated highways stand out as some of the lowest-scoring streets in New York.
The researchers note in their report [PDF] that “suburban houses with manicured lawns and streets lined with trees” tend to score highly. However, the New York City map shows that several extremely dense urban streets, such as Manhattan avenues, also get very high scores.
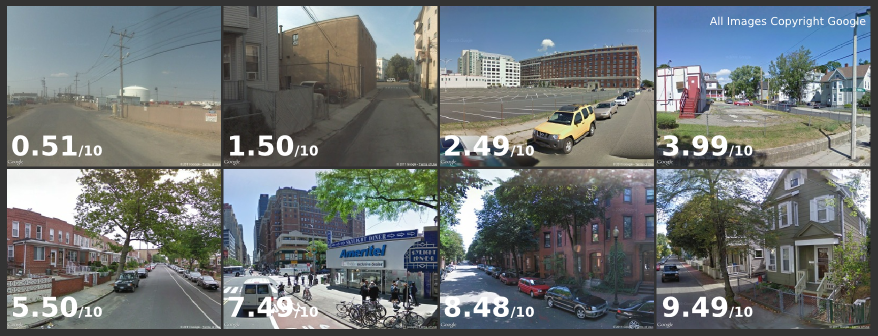
Here’s how a random sample of streets ranked, on a scale of 1 to 10, 10 being the safest.
You can contribute to the project and help improve the tool’s accuracy by evaluating street images in an online survey.

Read More:
Streetsblog has migrated to a new comment system. New commenters can register directly in the comments section of any article. Returning commenters: your previous comments and display name have been preserved, but you'll need to reclaim your account by clicking "Forgot your password?" on the sign-in form, entering your email, and following the verification link to set a new password — this is required because passwords could not be carried over during the migration. For questions, contact tips@streetsblog.org.