8 Takeaways From the Bike League’s Study of Cyclist Fatalities
When someone is killed while riding a bike in the United States, the most follow-up you’ll usually see is a newspaper article or two. There’s rarely a trial or a detailed examination of what went wrong.
The federal government tracks bike fatalities, but only to a limited extent. We don’t have great data about the wider story: who’s harmed and what factors are leading to these preventable deaths.
The League of American Bicycists wanted to go deeper. Between February 2011 to February 2013, the organization sifted through hundreds of cases from across the country. Using newspaper and television reports and blogs, they were able to get a closer look at 628 individual cases and tease out some patterns.
The cases they examined don’t account for every bike fatality during the study period (more like a third of them), but they are instructive. The League also supplemented its research with data from the NHTSA’s Fatality Analysis Reporting System (FARS).
Below are some of the takeaways from the Bike League’s summary of its findings [PDF]:
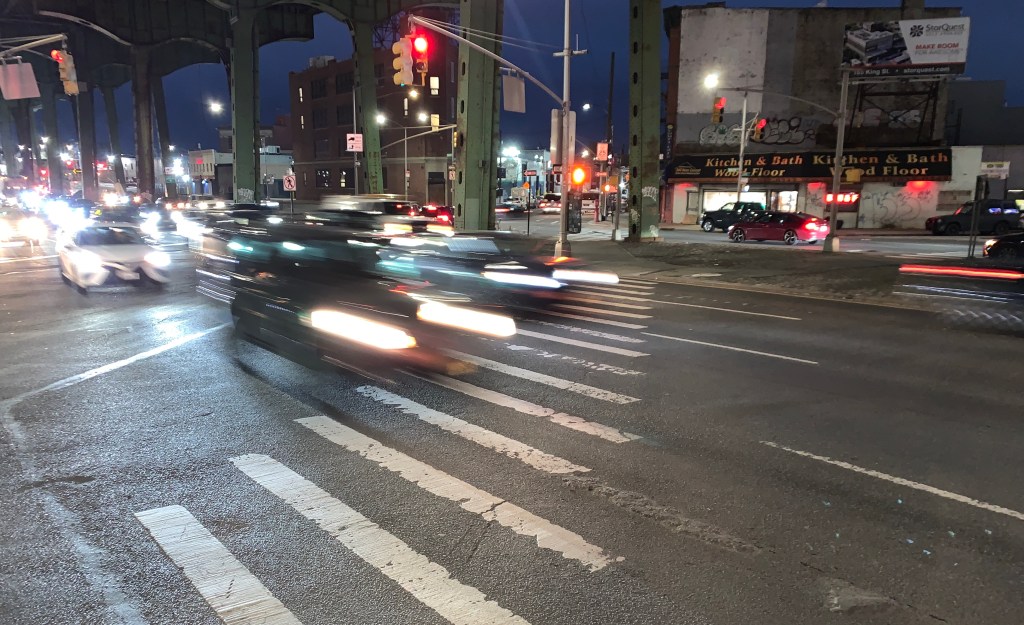
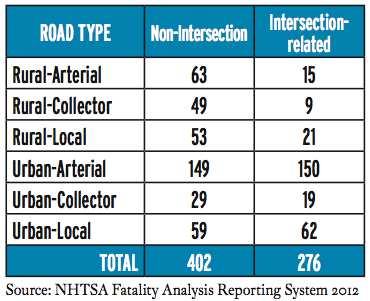
1. Most fatalities occur on urban arterial roads
Fatalities were concentrated on high-speed “arterials” designed to speed motor vehicle traffic through urban areas. The second most frequent road category for cycling fatalities was local streets in urban areas.
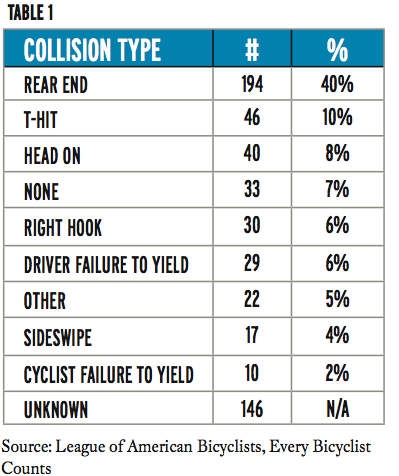
2. The most common type of crash was being struck from behind
In 40 percent of the cases, the victim was struck from behind. The second-most common category was T-bone crashes, which accounted for 10 percent of fatal crashes. Head-on collisions (8 percent) and right-hook crashes, where the driver makes a right turn into a traveling straight (6 percent), were relatively less common.
3. In urban areas, cyclists were more likely to be killed at intersections
Cyclists traveling in rural areas were 3.7 times more likely to be struck and killed at a location that was not an intersection than urban cyclists.
4. Most victims were wearing a helmet
In the 150 cases where helmet use was cited in a crash account, 57 percent of the victims were wearing a helmet.
5. Penalties varied based on the age and gender of the victim
Using news reports, it was only possible to track sentencing in a limited number of cases. Nevertheless, the Bike League found that harsher sentences were handed down to motorists who killed female cyclists, and to motorists who killed cyclists between the ages of 20 and 30.
6. If more people bike in your state, you’re less likely to be killed
The national fatality rate was 8.6 deaths per 10,000 regular commuters, between 2008 and 2012. In every state — except Florida — higher than average bike commuting rates translated to lower fatality risk.
7. Media reports about bike crashes are flawed
Working from press accounts to compile data on bike crashes can be tricky, because as the League notes, stories tend to be told from the survivor’s perspective. Basic facts like who had the right of way are often overlooked, and crashes are often presented in a manner that exculpates the motorist.
8. States aren’t tracking cycling fatalities very uniformly, if at all, which limits progress
Of the top 10 states for cycling, eight were tracking cycling collisions, but they weren’t all tracking crash type or motorist and cyclist information, and they weren’t collecting information uniformly across states. Without this type of data, the Bike League says, it’s difficult to determine whether road safety is improving and whether certain policies are improving outcomes.

Read More:
Streetsblog has migrated to a new comment system. New commenters can register directly in the comments section of any article. Returning commenters: your previous comments and display name have been preserved, but you'll need to reclaim your account by clicking "Forgot your password?" on the sign-in form, entering your email, and following the verification link to set a new password — this is required because passwords could not be carried over during the migration. For questions, contact tips@streetsblog.org.