5 Things You Should Know About the State of Walking and Biking in the U.S
The Alliance for Biking and Walking released its big biannual benchmarking report today, a 200-page document that measures the scope, status, and benefits of biking and walking across the United States, using 2011 and 2012 data to update its previous reports.
Streetsblog will be running a series of posts looking at the Alliance’s findings over the next few days. To start it all off, here are a few of the key takeaways:
1. Biking and walking are growing — slowly
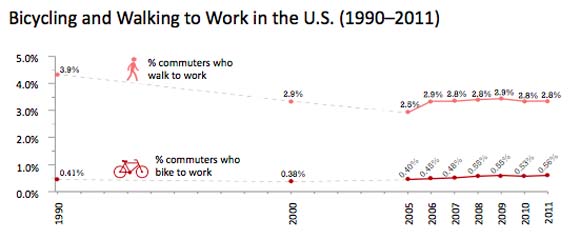
Nationwide, 3.4 percent of commuters got to work by foot or bike in 2011 and 2012.
In those two years, walking accounted for 2.8 percent of work trips, up from 2.5 percent in 2005 but not perceptibly different than any year since. Nationwide, bike commute mode share stood at 0.6 percent in 2012, up from 0.4 percent in 2005 but not much different than when the previous benchmarking report came out two years ago.
The Alliance calls this a continuation of the “very gradual trend of increasing biking and walking to work.”
2. But walking to work is growing more noticeably in cities
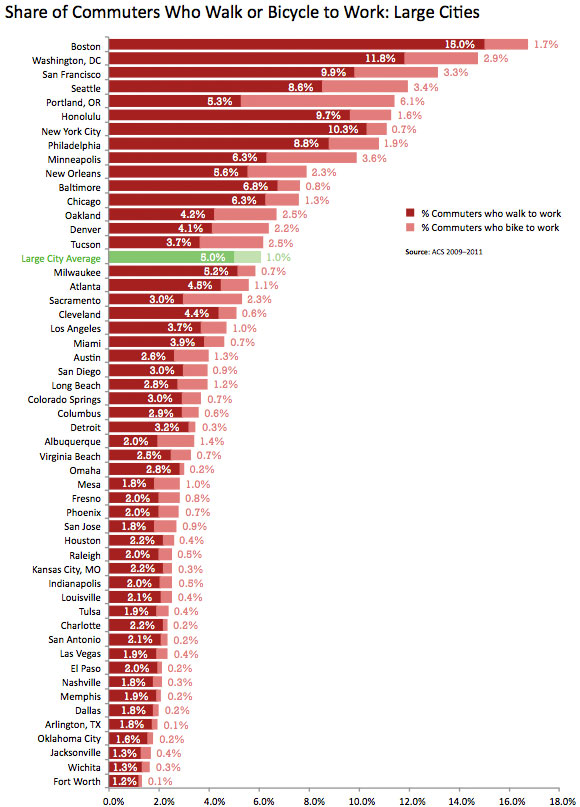
In the 50 largest cities, however, a recent increase in walking is somewhat more discernible. The walking commute share rose to 5 percent in 2012 — half a percentage point higher than in 2005. Meanwhile, bike commuting in the 50 largest cities rose to 1 percent mode share in 2012 from 0.7 percent in 2005.
Boston had the highest share of walking commuters at 15 percent, and Portland had the highest share of bike commuters at 6.1 percent.
Keep in mind that these mode-share numbers are based on the Census, which only counts people who bike or walk for the longest part of their commute more than three days a week. As we’ll see, this understates total biking and walking activity.
3. We still don’t have great data on biking and walking
That’s one problem the report seeks to address. Most local government agencies don’t devote a great deal of resources to tracking walking and biking trips — although the Alliance reports that more and more do.
Federal data collection like the Census tends to collect data from 50,000 feet, without much detail. A major purpose of the Alliance report is to establish baseline measures that will allow advocates to set goals and measure their progress in improving active transportation.
4. Biking and walking are more common than Census data suggests
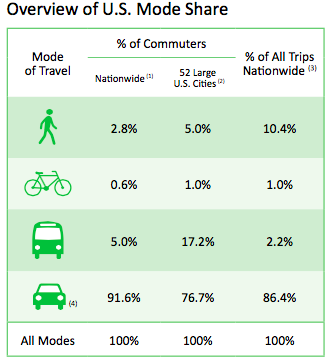
Bicycling accounts for 1 percent of total trips in the U.S. and walking makes up 10.4 percent. That’s based on the National Household Travel Survey, last conducted in 2009. The sample sizes are also small, so again, the data is not perfect. According to that survey, 13 percent of Americans take one biking trip a week and 68 percent take one walking trip. Almost a quarter of Americans take one daily walking trip and 2 percent take one daily trip by bike.
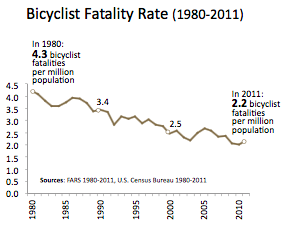
5. Bicycling and pedestrian fatalities have increased lately, but the long-term trend is downward
In 2011, bicyclists and pedestrians accounted for 15.8 percent of traffic fatalities, up from 12.6 percent in 2003. Even in terms of absolute numbers, more cyclists and pedestrians were killed in 2012 than 2011 — a disturbing development.
Long-term trends, however, are positive. Between 1980 and 2011, the pedestrian death rate declined from 35.5 to 14.2 per million people per year. The bike fatality rate also dropped in that period, from 4.3 to 2.2 per million people per year. (As we reported last week, despite these improvements, safety on American streets still lags far behind our peer countries.)
Biking was safer in large cities, where, according to the Alliance, there were 4.9 cyclist deaths for every 10,000 bike commuters counted by the Census, compared to a fatality rate of 8.5 per 10,000 nationwide.

Streetsblog has migrated to a new comment system. New commenters can register directly in the comments section of any article. Returning commenters: your previous comments and display name have been preserved, but you'll need to reclaim your account by clicking "Forgot your password?" on the sign-in form, entering your email, and following the verification link to set a new password — this is required because passwords could not be carried over during the migration. For questions, contact tips@streetsblog.org.