The official 2012 death toll is out for our nation's poorly-designed, auto-centric transportation system. According to the National Highway Traffic Safety Administration, traffic injuries on the nation's roadways claimed the lives of 33,561 people. The headline of the agency's press release, "NHTSA Data Confirms Traffic Fatalities Increased In 2012," is quickly walked back by the subhed, which attempts a silver lining: "Highway deaths over the past 5 years remain at historic lows."

The final 2012 number is lower than NHTSA's previous estimate of 34,080 but still higher than the 2011 death toll of 32,479. That's a 3.3 percent increase -- a difference of more than a thousand lives. It's the first time since 2005 that the number of fatalities has gone up.
The number of people who died in alcohol-impaired-driving crashes increased by 4.6 percent last year, NHTSA reports, accounting for 31 percent of all deaths.
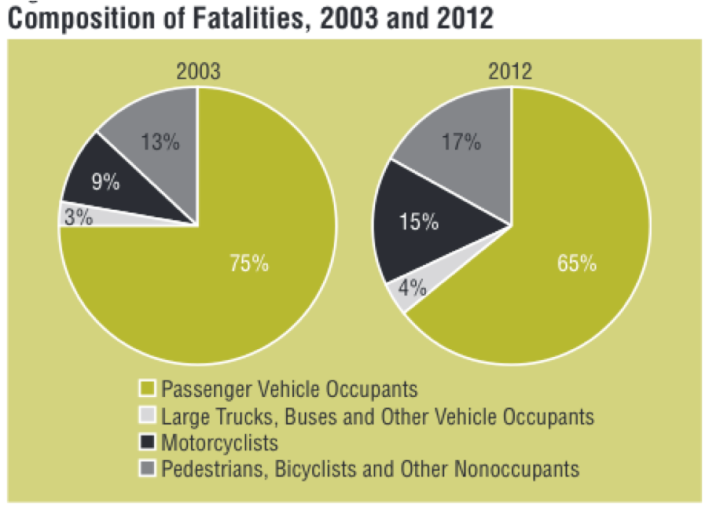
Pedestrian and bicyclist deaths rose faster than the overall rate -- 6.4 and 6.5 percent, respectively. Last year, 4,743 people were killed while walking and 726 while biking. This is a long-term trend: Walking and biking are becoming more dangerous relative to driving. Occupants of passenger vehicles make up 65 percent of fatalities now, down from 75 percent in 2003, while "non-occupants" (i.e. pedestrians and cyclists) make up 17 percent, up from 13 percent. Motorcyclists now account for 15 percent of casualties, up from 9 percent.
A state-by-state breakdown is available on the last page of the NHTSA report [PDF]. The biggest increases in traffic deaths were in Hawaii (26 percent), Maine (21 percent), New Hampshire (20 percent), South Dakota (20 percent) and Vermont (40 percent). The biggest improvements were in DC (44 percent reduction) and Alaska (18 percent reduction).
Overall traffic injuries rose 6.5 percent -- but 10 percent for people walking. Cyclist injuries went up by 2.1 percent.
Preliminary data indicates that 2013 may not be quite so deadly. In the first half of this year, 15,470 people were killed, compared with 16,150 in the first half of last year.


