Has America Already Hit “Peak Car”?
In 1901, there were 10,000 motor vehicles in the United States.
It took five years to multiply that number by 10. The next 10-fold increase took seven years, reaching one million vehicles by 1913. Just eight years later, it was 10 million.
From there, it took 47 years to get to the next milestone: America became a 100 million-car nation in 1968. Automobiles were everywhere.
It stands to reason that the number of cars in America eventually crept upward at a much slower pace – and then started to decline. The total number of light duty vehicles in the United States topped out in 2008 at 236.4 million, according to a recent analysis of FHWA and Census numbers by Michael Sivak, the director of the Sustainable Worldwide Transportation program at the University of Michigan’s Transportation Research Institute.
In his report, “Has Motorization in the U.S. Peaked?” [PDF], Sivak concludes that the dip in total vehicles coincides with the economic downturn and will probably rise again with population.
But significantly, Sivak found that the ratio of cars to people is dropping – and will likely continue to drop. Since these rates started to decline before the recession, Sivak concludes that there are other explanations for the decline.
“These rates started to decline not because of economic changes but because of other societal changes that influence the need for vehicles,” Sivak wrote. “Thus, in contrast to the absolute numbers, the recent maxima in the rates have a better chance of being long-term peaks as well.
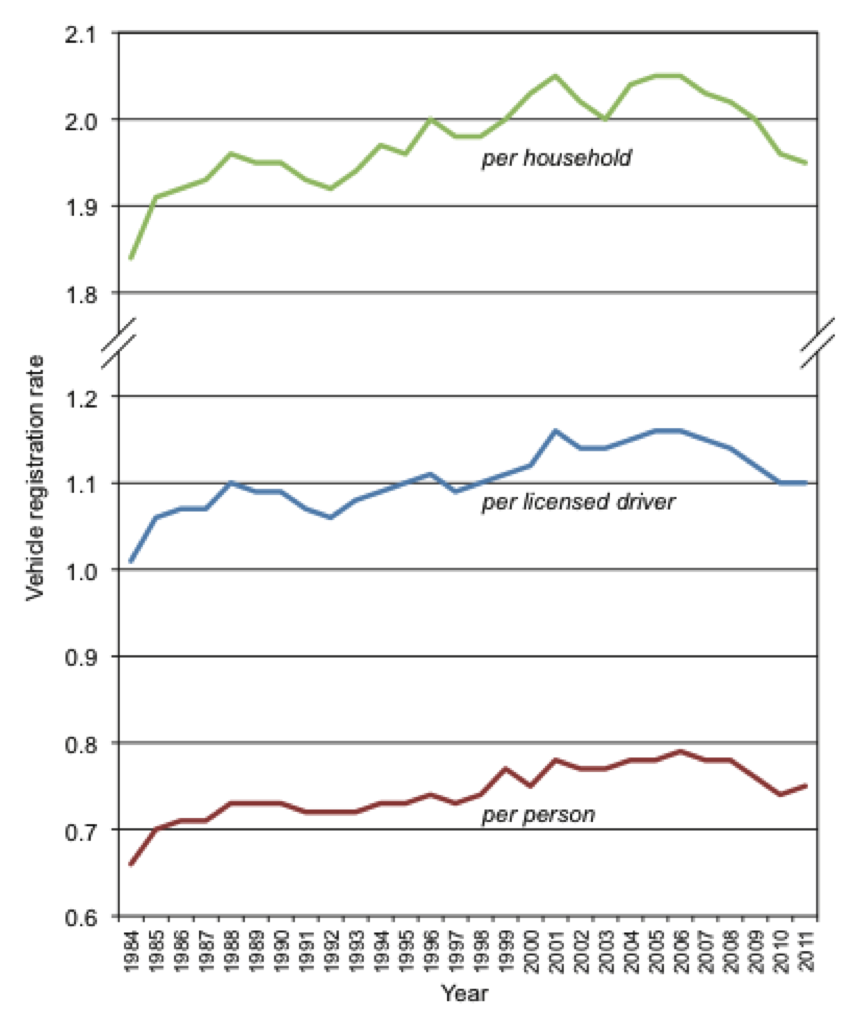
Vehicle ratios per person, per licensed driver, and per household all peaked between 2001 and 2006. There were 0.79 vehicles per person in 2006 and 0.75 in 2011, the most recent year for which data are available. Vehicles per licensed driver hit 1.16 in 2001, 2005, and 2006 but is now back down to 1.10. And in 2011, the number of vehicles per household was at its lowest point since 1993 – 1.95 vehicles per household, after being above 2.0 for 11 years.
Maybe it’s because about one-third more people are telecommuting than in 2000, Sivak speculates, or because the share of Americans commuting by transit has risen from 4.7 percent to 5.0 percent.
The decline in driving has been measured in countless ways – reduced vehicles miles driven, teens getting drivers licenses later, changing priorities about where to live and how to travel. The decline in household and personal car ownership rates is another lens through which to view our rapidly changing societal trend toward more sustainable transportation and more livable communities.
No wonder Ford is worried.

Read More:
Streetsblog has migrated to a new comment system. New commenters can register directly in the comments section of any article. Returning commenters: your previous comments and display name have been preserved, but you'll need to reclaim your account by clicking "Forgot your password?" on the sign-in form, entering your email, and following the verification link to set a new password — this is required because passwords could not be carried over during the migration. For questions, contact tips@streetsblog.org.