Which Counties Have the Biggest Oil Addiction Problem? We Still Don’t Know.
Have you ever thought to yourself, “What I really need is a map showing what U.S. counties use the most gasoline, so that I can target my sustainability efforts there?” Funny, the Natural Resources Defense Council and Sierra Club were thinking the same thing. What they came up with gets us partway there.
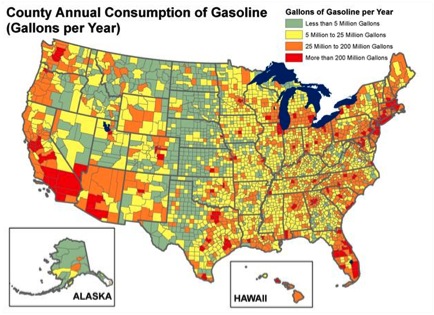
“We were curious about which geographic areas were most oil dependent, and thus, driving the country’s oil addiction the most,” said Deron Lovaas of NRDC in his blog post. So they made this map of 2010 oil consumption by county.
It has the potential to be a useful tool, especially for groups like these that might be trying to figure out where to concentrate their field organizing efforts. But the map doesn’t tell us quite enough to be useful. This chart they made of the top ten gasoline consuming counties is a little more revealing:
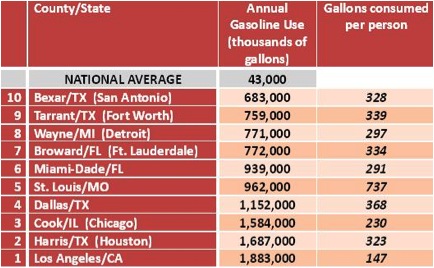
They find Los Angeles County to be the worst offender, burning 1.9 billion gallons of gasoline per year. It stands to reason that L.A. County would be at the top of the list: it’s the most populous county in the country, with 9.8 million people in 2010. That’s more than twice the population of the next highest fuel consumer on the NRDC/Sierra Club map: Harris County, Texas, where Houston is located. In fact, according to a similar ranking on StateMaster.com, the state of California comes in dead last on per capita fuel consumption and, remarkably, 28th in the country for total fuel consumption, despite being the most populous state in the nation.
The chart itself illustrates that disparity: L.A. County, while it has the highest total fuel consumption, has the lowest per-capita fuel use of the top ten. Meanwhile, Harris and Dallas County residents drive more than twice as much, per person, as L.A. denizens. (Note: Lovaas cautions that the St. Louis number should be taken “with a giant grain of salt” due to potentially faulty data.)
Considering L.A.’s innovative leadership on transit and bikability, as well as the Southern California Association of Governments’ sustainability plan, L.A. is already working on its fuel consumption. Despite its first place honors in the fuel consumption category, it’s not ground zero for the country’s oil addiction.
NRDC and Sierra Club did not publish the list of counties with the highest per-capita fuel use because, according to Lovaas, they were mostly highly rural counties where efforts to reduce consumption wouldn’t have much effect since there were so few people there. (Besides, in many of those areas, a large percentage of VMT is through-traffic that doesn’t originate or end in the county.)What would have been more useful than either the map they published or the per-capita map they didn’t publish would have been an overlay of the two, showing places where a lot of people are each using a lot of gasoline.
Lovaas said they’ve had similar challenges looking at VMT. For example, the New York metro area showed 93.7 billion vehicle miles traveled for 2008. Compare that to Charlotte, North Carolina, with just 13.7 billion, and it looks like New York is the gas-guzzler – until you look at population. New York metro’s per-capita VMT was 4,914 vs. Charlotte metro’s 7,856.
Another question mark here is the accuracy of the fuel consumption figures. The researchers figured gas consumption using VMT numbers and multiplying that by the national average for fuel economy. But people drive very different kinds of vehicles in different parts of the country. Driving a mile in an L.A. electric car is a whole different ball game than a Dallas pickup.
I’m not trying to nit-pick here. NRDC and Sierra Club are on to something. They’ve raised the prospect of mapping fuel consumption as a way to target efforts to reduce oil dependency, and so it’s a little frustrating that this map doesn’t get us all the way there. This is an important issue, after all. As Lovaas writes:
America buys 18.8 million barrels of petroleum products every day, accounting for more than 20 percent of all global usage. This can drain roughly $1 billion on average every day out of the economy. This oil use also accounts for more than a quarter of the heat-trapping carbon pollution emitted by various sources in the U.S.
Those are pretty good reasons to figure out where the U.S. is over-using gasoline and stage an intervention, like you would with any addict. As Lovaas says, the solution for these places is within reach: better transit, more transportation choices, and better fuel efficiency.

Read More:
Streetsblog has migrated to a new comment system. New commenters can register directly in the comments section of any article. Returning commenters: your previous comments and display name have been preserved, but you'll need to reclaim your account by clicking "Forgot your password?" on the sign-in form, entering your email, and following the verification link to set a new password — this is required because passwords could not be carried over during the migration. For questions, contact tips@streetsblog.org.