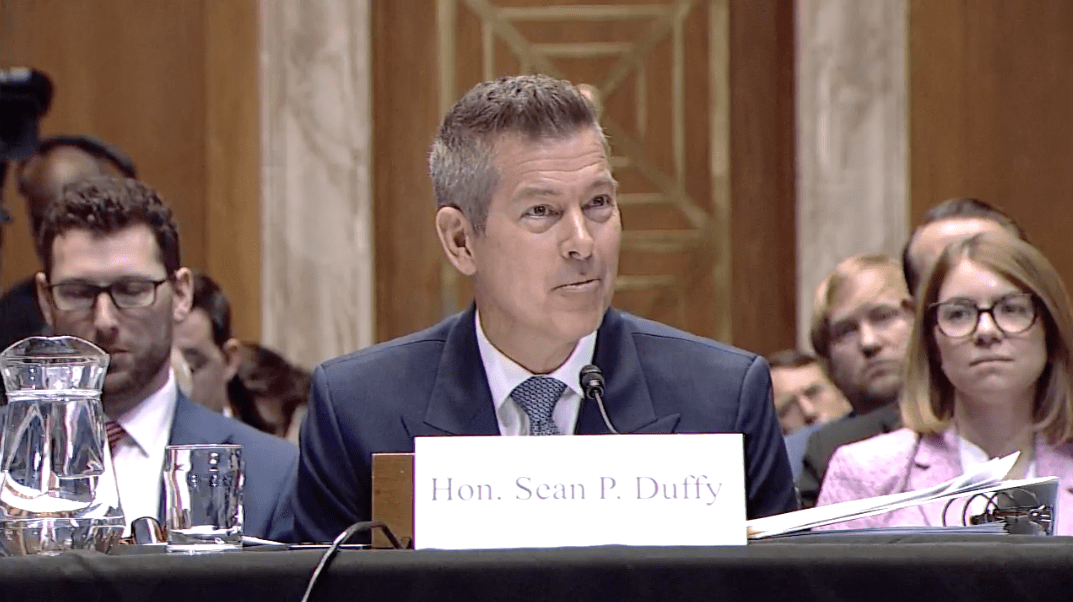
 Surface parking stretches halfway to the horizon in the heart of downtown Wichita. (Photo: Wichita Walkshop via Flickr.)
If you haven't checked out the ITDP parking report we covered yesterday, it's a highly readable piece of research, walking you through parking policy's checkered past and potentially brighter future.
In addition to describing six cases of innovative parking strategies, the authors draw from a wide-ranging body of evidence about the woeful state of most current parking policy, marshaling revealing facts and figures. We culled some of the ones that leap out the most. Enjoy:
- Ninety-nine percent of U.S. car trips begin and end in a free parking space.
- The average automobile is parked 95 percent of the time.
- Although many businesses today believe they benefit from free parking, curbside parking meters were actually introduced in 1935 by an Oklahoma City department store owner. He wanted to increase parking turnover so that there would always be spaces available for his customers.
- Conventional parking policy counsels providing enough spots to handle car storage on the 30th busiest hour of the entire year, usually the weekend before Christmas. That means intentionally planning for an oversupply of parking the other 8,730 hours of the year.
- At free parking spaces, 40 to 60 percent of vehicles overstay posted time limits.
- Parking typically represents a full 10 percent of development costs.What's more, the people who actually park only pay 5 percent of the cost of non-residential parking,meaning that public subsidies and developer capital pay for the rest.
- InSan Francisco, parking requirements have reduced the number of affordable housing units nonprofit developers can build by 20 percent,with each residence costing 20 percent more to build than it would have without parking.
- Seventy percent of Southern California suburban office developments built exactlythe number of parking spaces required by law, suggesting that parkingminimums are forcing developers to build more parking than they wantto.
- How much space does parking eat up? Office space typically requires 175 to 250 square feet per person. In comparison, curbside parking requires 200 square feet per vehicle, and garages require 300 to 350 square feet per vehicle.
- Even in the Park Smart pilot areas of Greenwich Village, where peak hour meter rates have been raised, on-street parking still costs $12 per hour less than off-street parking. At that rate, cruising for 15 minutes to find an on-street space pays off at the equivalent of a $100,000 annual salary.
- NYC has 32 fewer meters per capita than Chicago.
- Only two major U.S. cities, Houston and Chicago, are adding more metered parking. In Houston's case, they are more than doubling their metered spaces in coordination with the city's light rail project.
