How Deadly Are Your Community’s Streets? New Data Tool from USDOT Shows the Hard Truth
A new federal tool helps Americans see at a glance exactly how deadly traffic violence is in their community — and how their neighbors stack up.
As part of last week’s announcement of the first recipients of the new Safe Streets and Roads for All Program, the federal Department of Transportation quietly released a series of fascinating new visualizations that highlights crash “hotspots” at the city-, county, and even census-tract-scale, as well as the progress that some U.S. communities are already making towards achieving the zero part of Vision Zero.
The tool transforms a veritable motherlode of car crash fatality data into easy-to-understand interactive maps. And critically, that data calculates the death toll on a per capita basis, rather than relative to the number of vehicles miles traveled by drivers — a misleading metric that has been favored by DOTs for decades despite the fact that experts say it makes car-dominated places seem way safer than they actually are.
Of course, the visualizations aren’t perfect, nor are they exhaustive; there’s no map that specifically explores the prevalence of pedestrian and bicyclist fatalities in cities across the U.S., nor does DOT present more granular detail about car crashes that result in serious injuries, but don’t actually take a life.
Still, the entire site is worth a deep dive, and could prove to be a useful tool for advocates looking to quickly and quantifiably demonstrate just how much work is left to be done to achieve Vision Zero in their backyard. Here are a few national insights that caught our eye:
The most dangerous streets aren’t necessarily where you’d expect
Small- and medium-sized cities don’t always have an active street safety scene — but U.S. DOT’s new tool shows that many of them need Vision Zero the most.
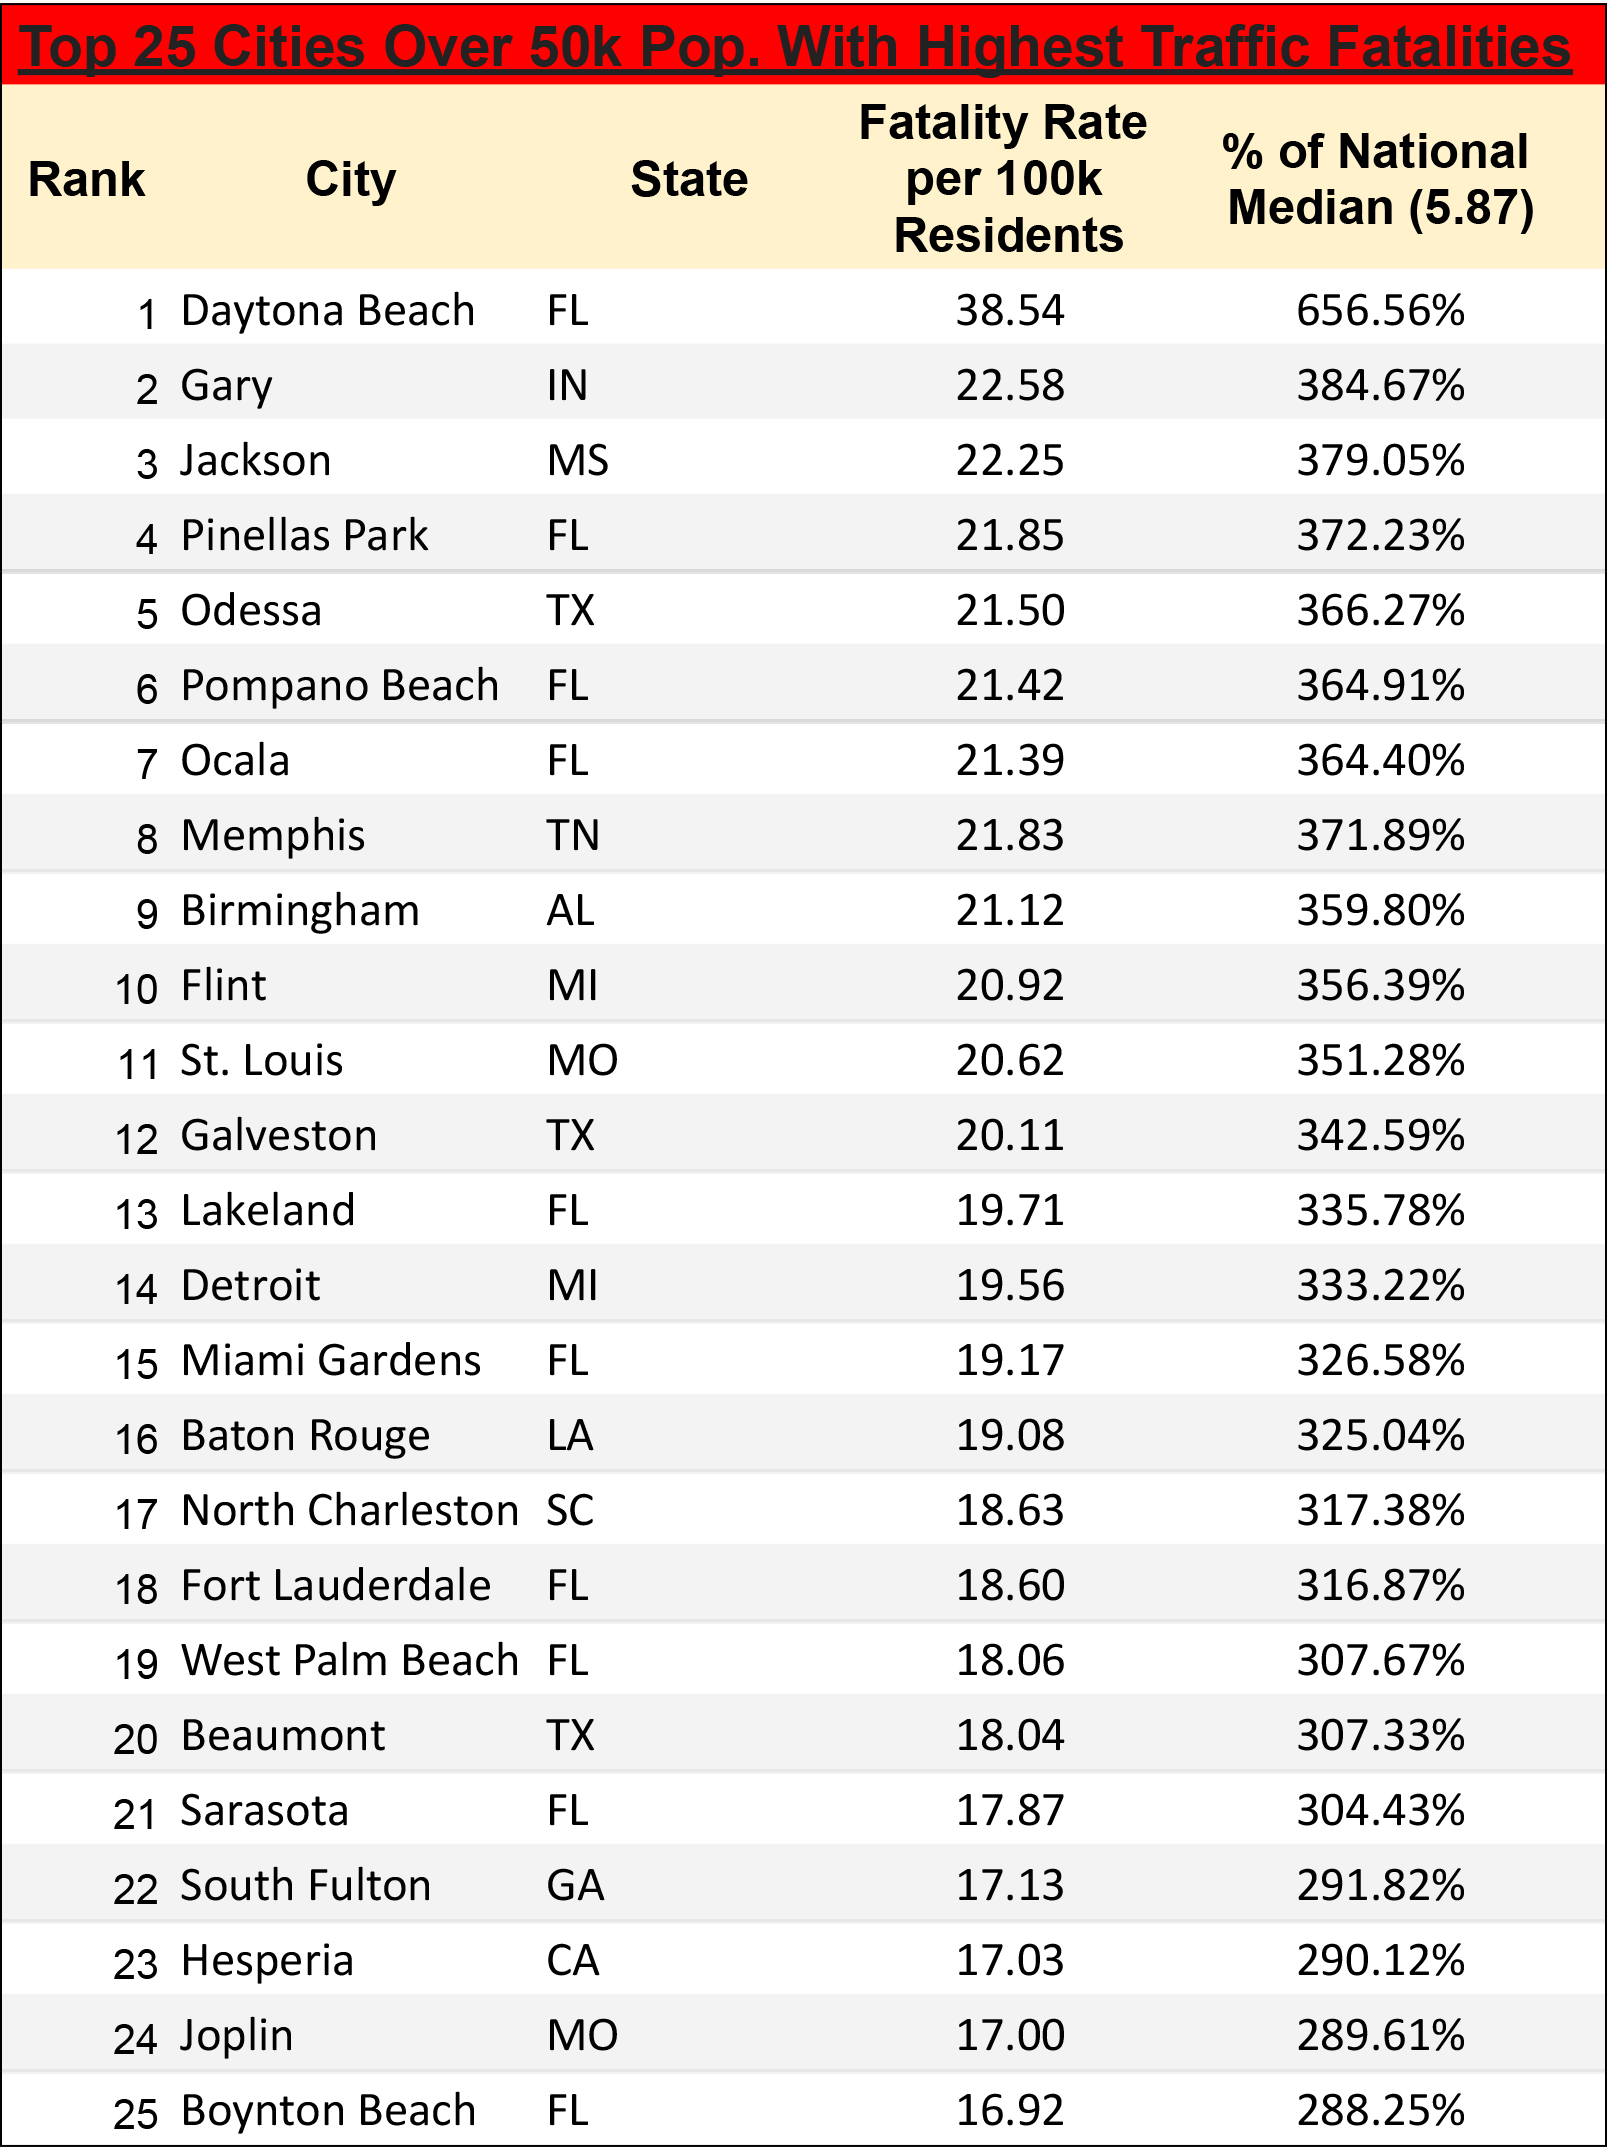
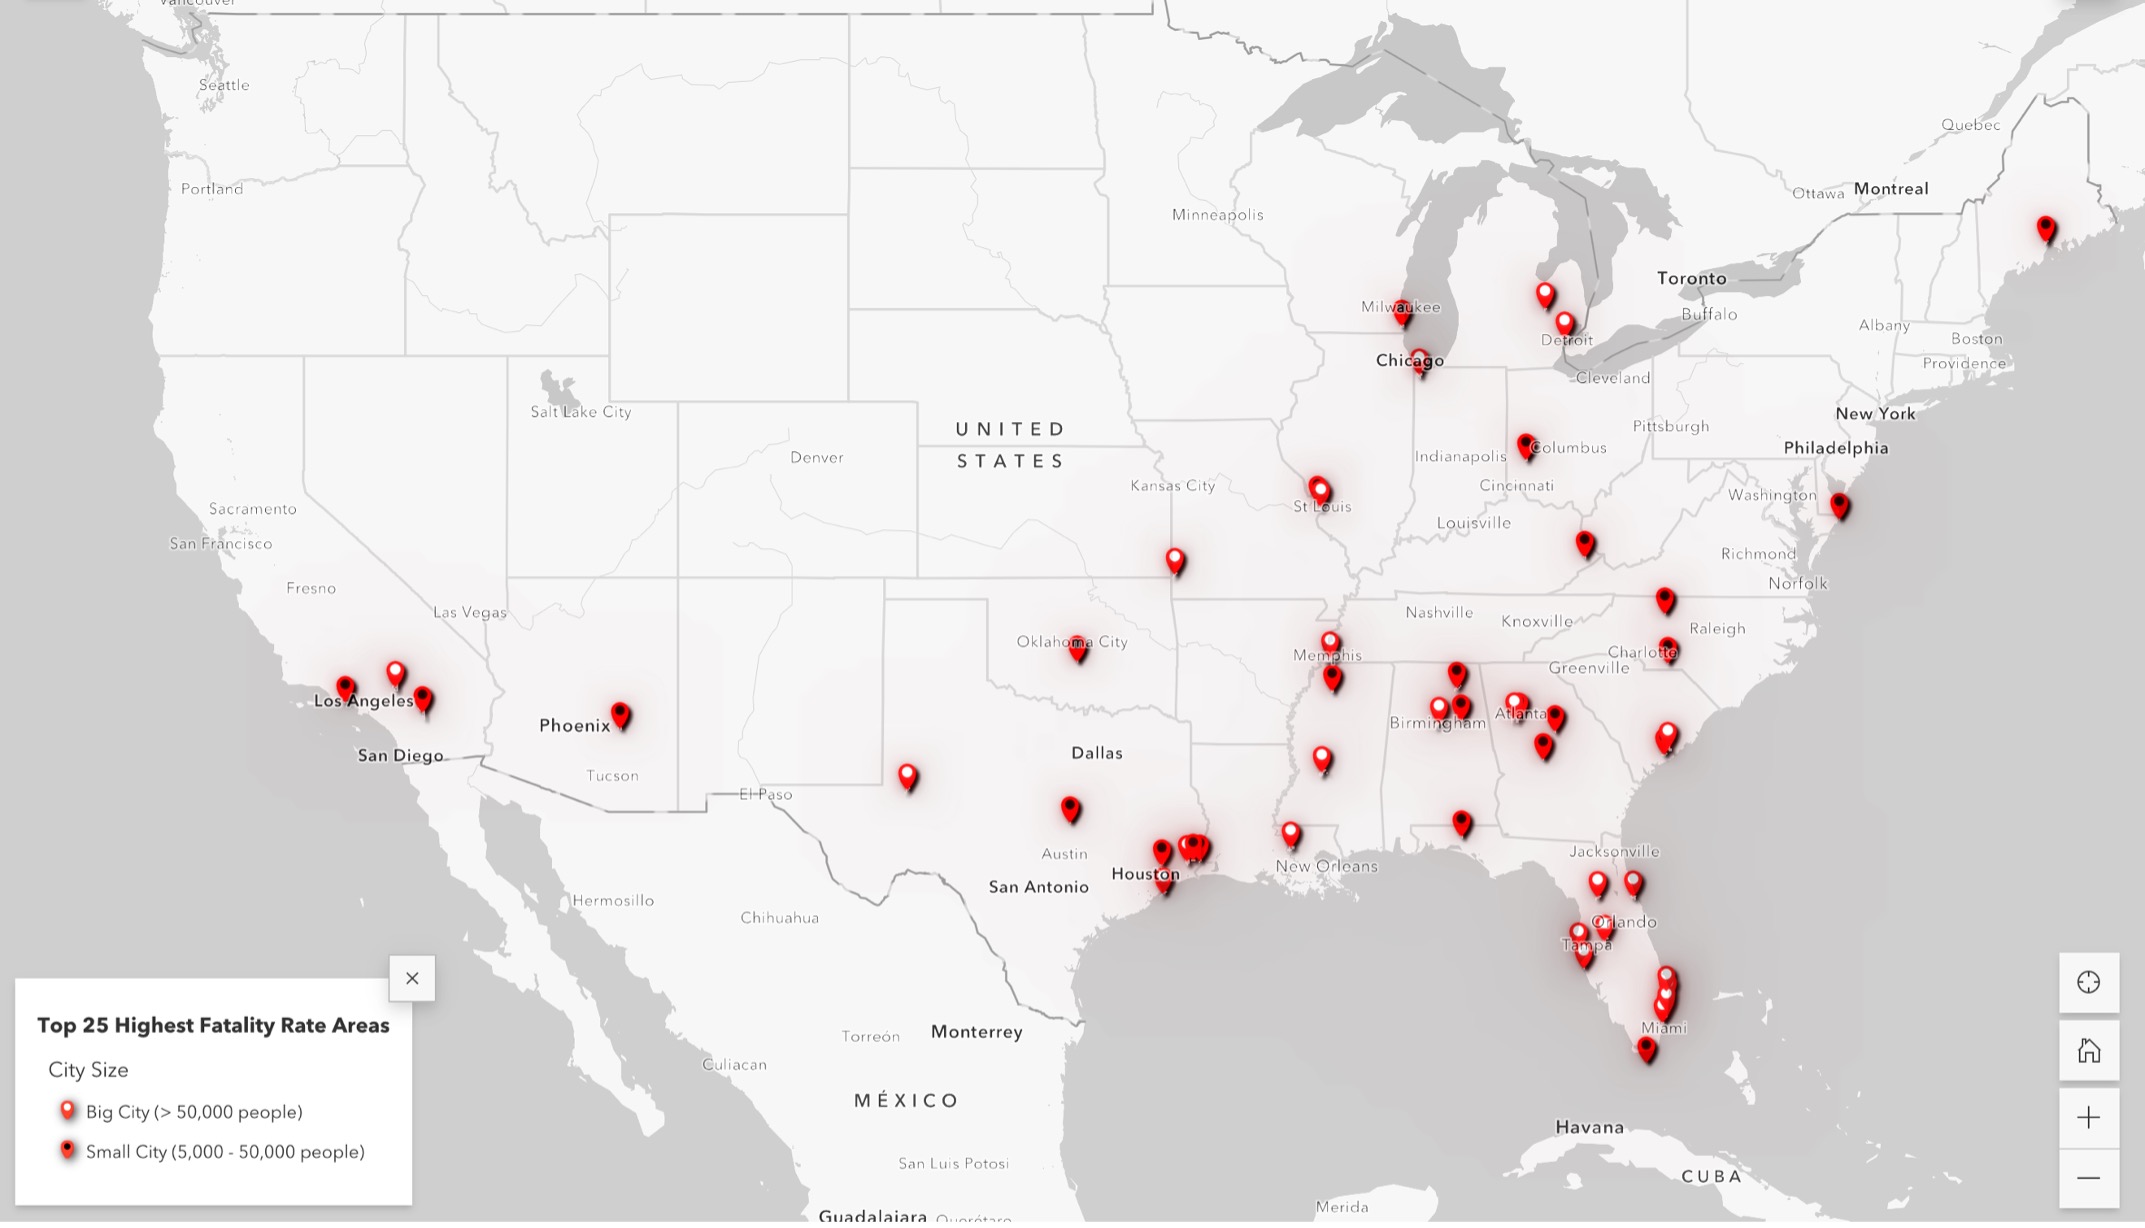
DOT identified 25 “big” cities — i.e. with more than 50,000 residents — as top car crash fatality hot spots, led by Daytona Beach, Fla., which posted six and a half times the national median rate of deaths per 100,000 residents between 2016 and 2020 (to see the full list, click here). The Sunshine State slaughterhouse also topped Smart Growth America’s 2022 Dangerous by Design rankings, which quantifies the most deadly places for pedestrians using a broader range of factors, as well as data from the larger metro area.
Gary, Ind. took the number two spot, and Mississippi capital Jackson took number three, though they were nowhere close to Daytona Beach, with 3.84 and 3.79 times the median rate of crash deaths, respectively. At the state level, Florida has the ignominious distinction of being home to a whopping 10 of the top 25 most deadly large cities in America.
Among small towns — those with populations under 50,000 — the little-known town of Dayton, Texas (located in the greater Houston metro) topped the list with a crash rate an astonishing 12.4 times the national median. (The fact that the city limits resemble a spider with highways for legs may have something to do with it, but it’s still horrifying).
College Park, Ga., which is home to a good chunk of the sprawling Hartsfield-Jackson Atlanta International Airport, didn’t fare much better with 10.5 times the national median, nor did Berkley, Mo., another airport-adjacent municipality, with 9.9. (Nearby St. Louis, for the record, clocked in at #12 on the list of most dangerous cities with populations over 50k.)
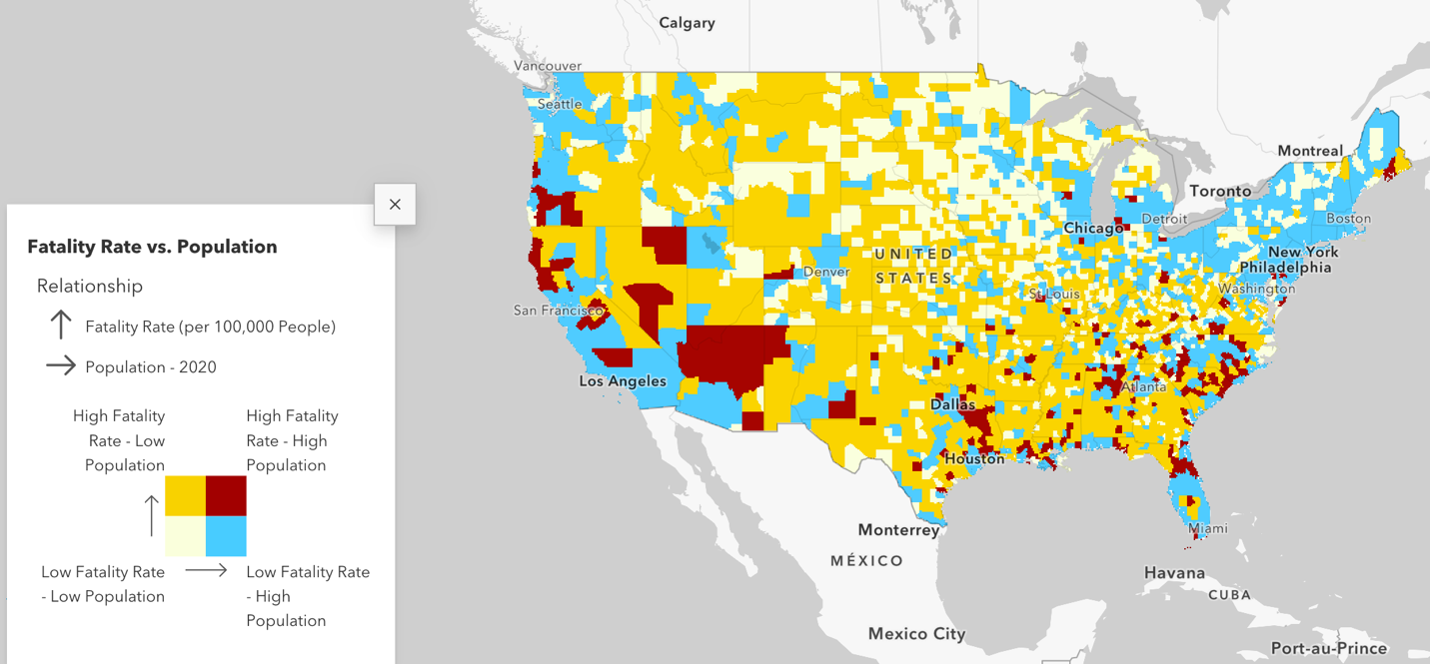
At the county level, though, the feds flagged a far broader swath of the United States as areas of high concern, including the entire northern half of Arizona, a huge segment of Nevada, and a decent percentage of northern California and southern Oregon. DOT officials also noted that the top 50 most dangerous counties on the list accounted for 24 percent of all fatalities nationally.
Advocates would be wise to click through and see if theirs is one of them, and if so, use that data to make the case to their local officials that they have a particularly critical role to play in ending U.S. car crash deaths.
A lot of U.S. cities have already achieved Vision Zero — though not always on purpose
Vision Zero is often presented as a lofty goal that probably won’t be achieved in our lifetimes, if ever. In a surprising number of small U.S. communities, though, it’s already the reality — even if only by happenstance.
As DOT points out, a stunning 14 percent of U.S. cities with populations between 5,000 and 50,000 experienced no car crash deaths between 2016 and 2020. Here’s a map of them all.
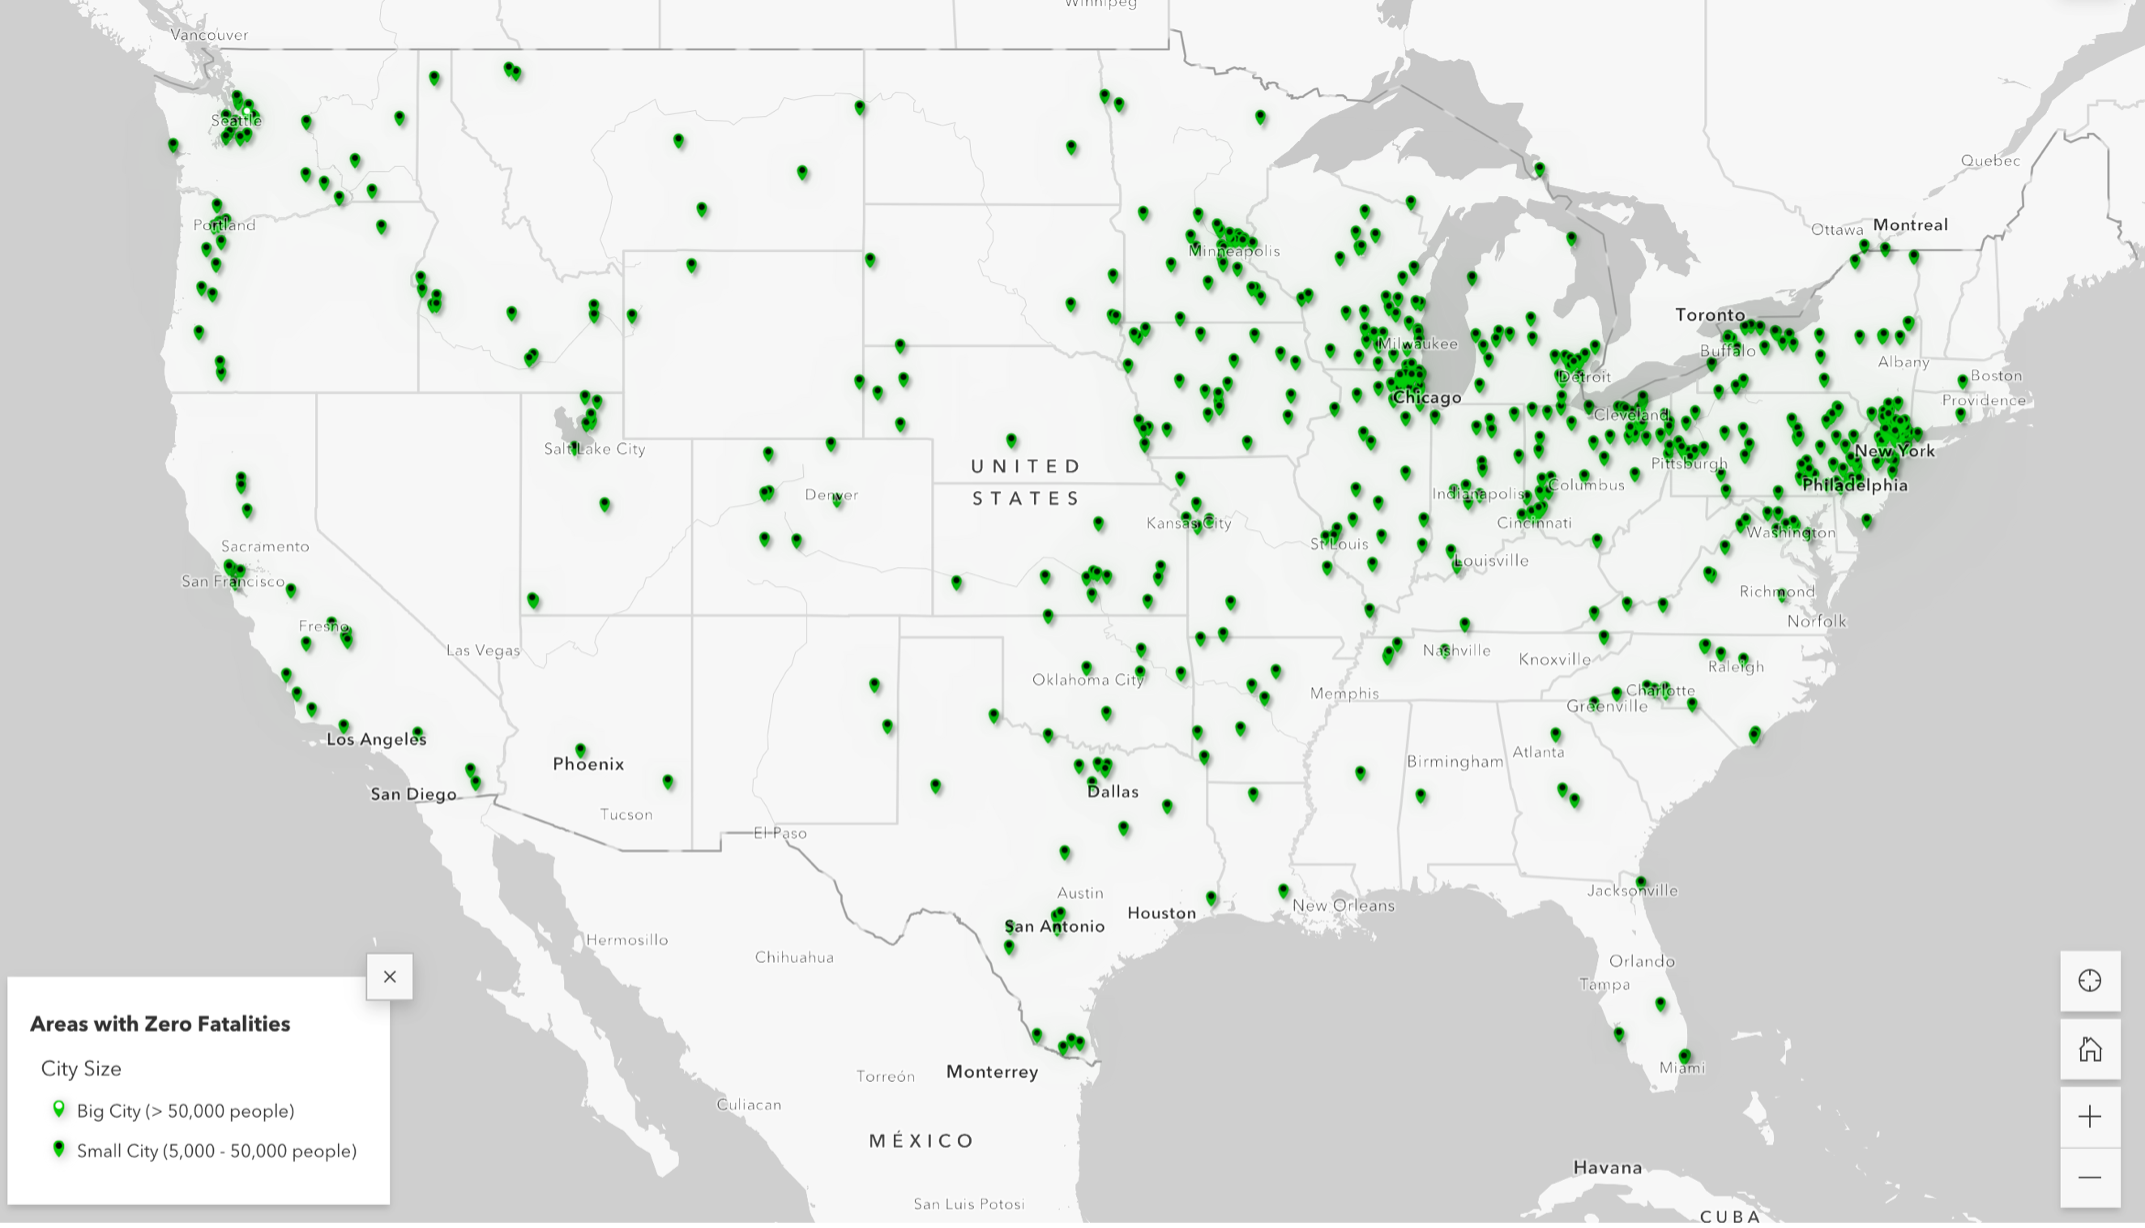
To be fair, the DOT doesn’t claim that all of these cities are dedicated Vision Zero warriors whose strategies other cities should emulate. Many are exclusive, minuscule suburbs that simply shunt faster vehicle traffic onto arterial roads outside their borders, effectively endangering residents every time they enter or leave; a lot are rural areas that receive little car traffic at all, never mind car crashes (though it should be noted that traffic violence, on aggregate, disproportionately impacts rural residents, even if tiny towns might go several years without a death on their specific roads).
We can find just one city on the map with a population over 50,000 that’s achieved Vision Zero for four years running: the Seattle suburb of Sammamish, Wash., which has a median household income roughly twice the national average.
Still, these maps should make it clear to doubters that Vision Zero is within reach, even in areas immediately adjacent to perennial crash hot spots. Detroit, for instance, which ranks as the 14th-most dangerous city over 50,000 residents, is surrounded by a cluster of eight small suburbs that have been car-crash-free for four years or more.
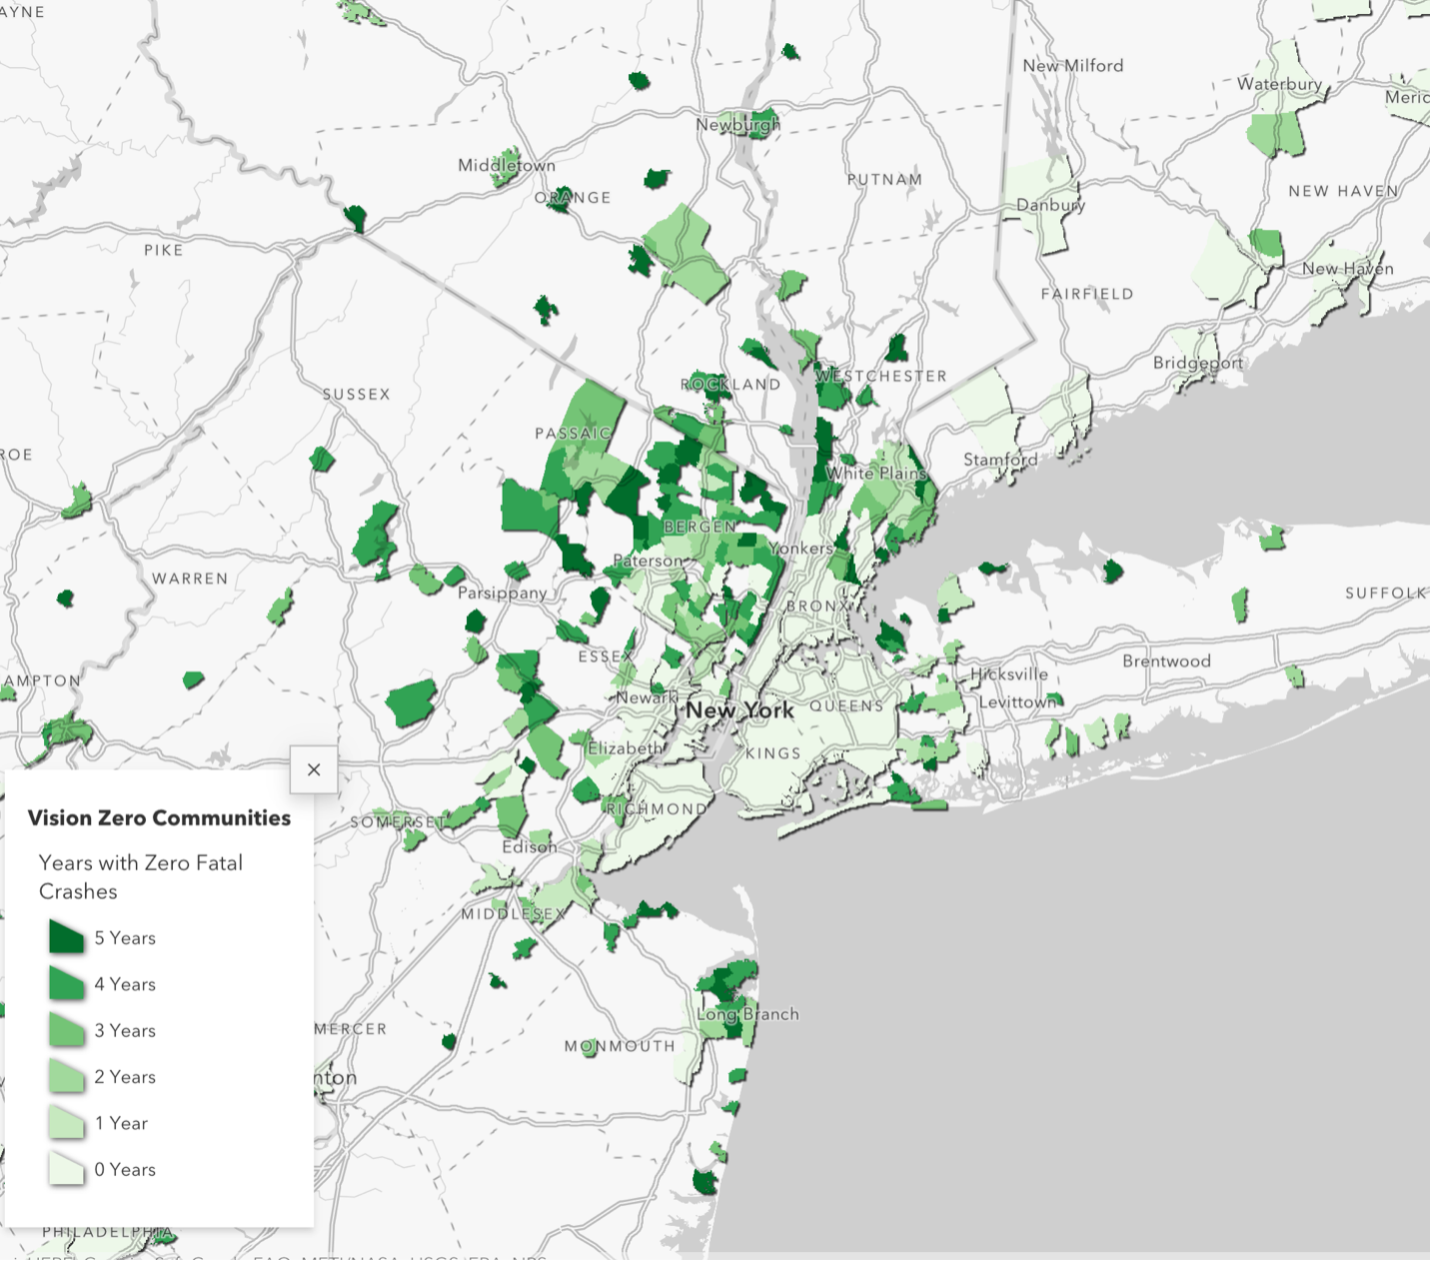
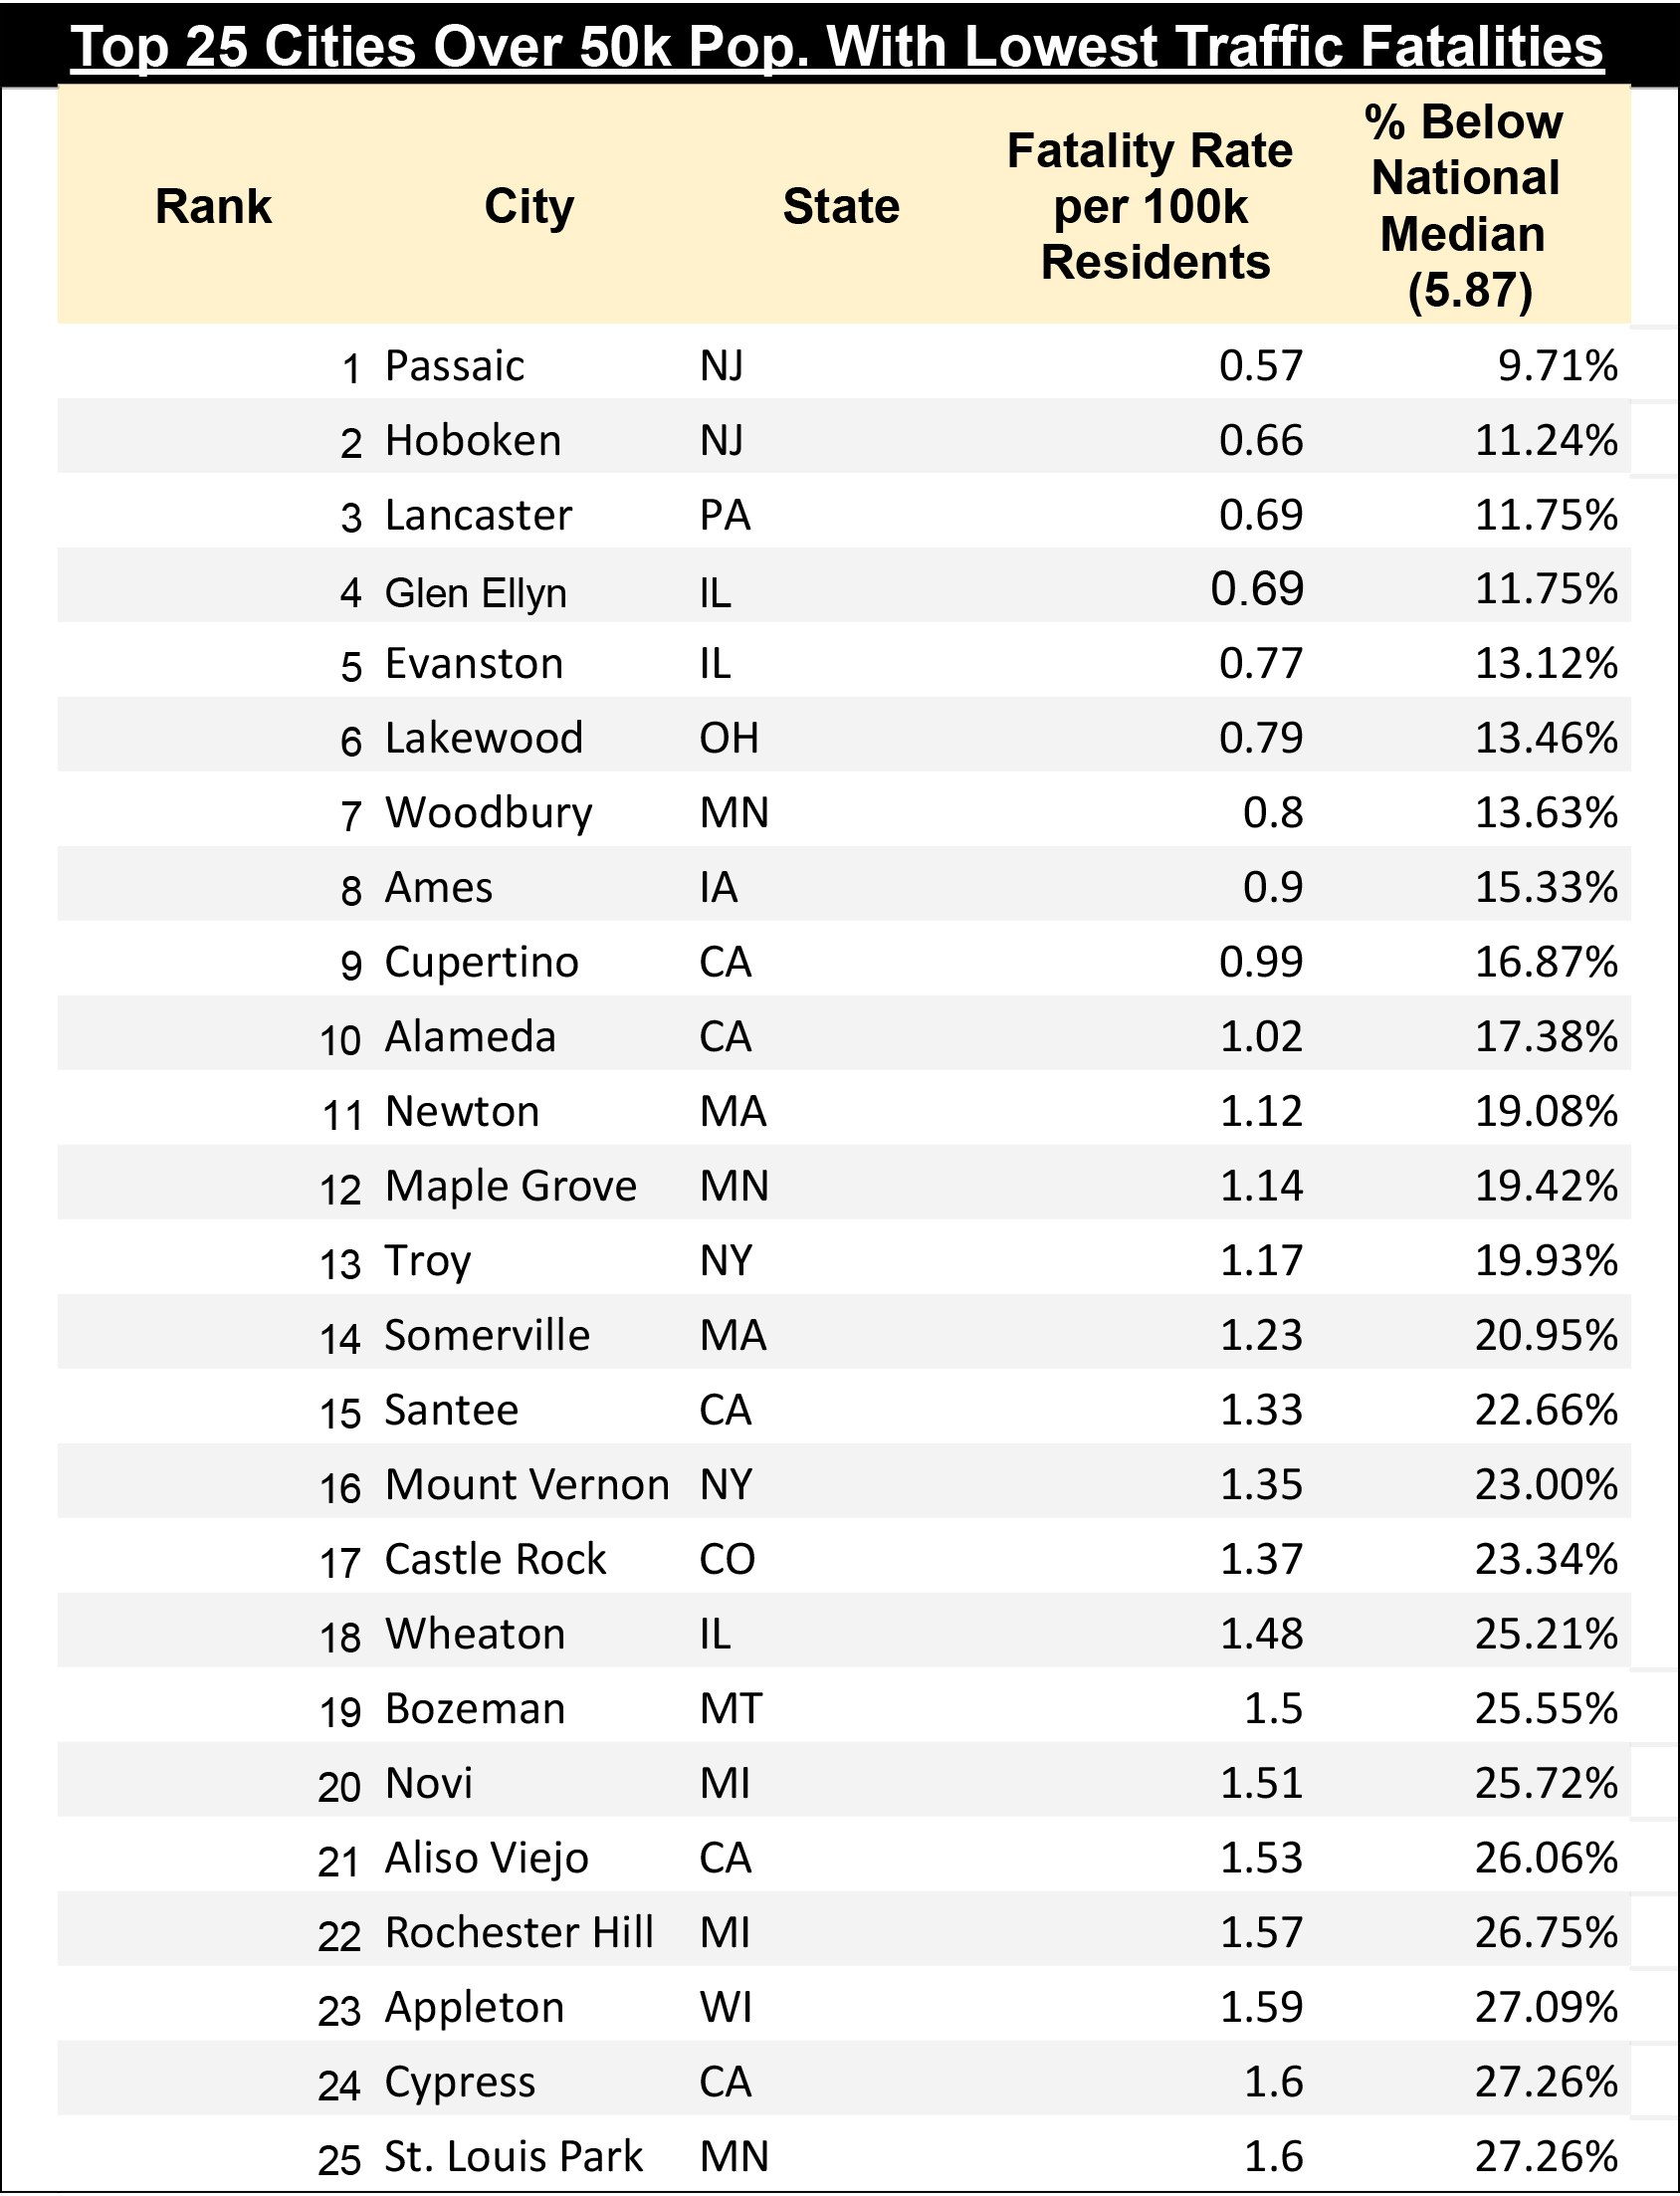
And while cities like Hoboken, N.J. have rightfully gotten a lot of attention for eliminating traffic deaths on their city roads through intentional, sustained infrastructure and policy action, another DOT map makes it abundantly clear that they’re not the only Big Apple-area city that’s accomplished that feat.
Of the larger cities that have done the best job of culling car crash deaths but haven’t yet gotten a perfect score of zero for the four year running, Hoboken actually had the second-lowest per capita fatality rate of communities over 50,000; nearby Passaic, N.J. took the top spot, and Lancaster, Penn. tied for third with the Chicagoland suburb of Glen Ellyn, Ill.
People in poverty are the ones getting hurt the most
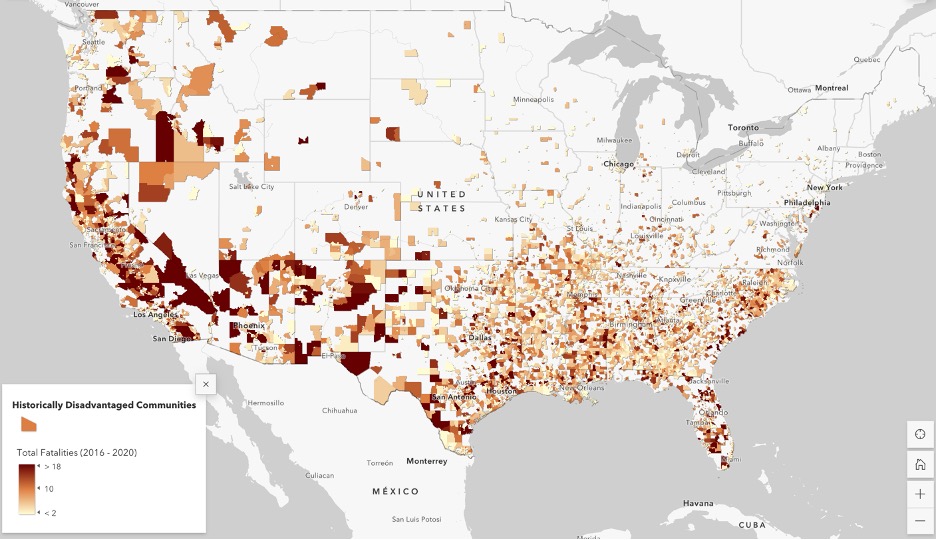
It will come as no surprise to mobility justice advocates that car crash deaths are disproportionately concentrated in communities with less access to privilege and wealth, particularly communities of color. The new DOT maps, though, gives Americans the tools to see exactly how bad things are in their specific places — and where we should direct our resources to have the greatest impact.
Here’s a visualization of where crash fatalities overlapped with federally designated Historically Disadvantaged Communities over the four years the agency studied — 26 percent of which resulted in the death of a pedestrian. Be sure to click through to explore your specific city or county at the census tract level.

Read More:
Streetsblog has migrated to a new comment system. New commenters can register directly in the comments section of any article. Returning commenters: your previous comments and display name have been preserved, but you'll need to reclaim your account by clicking "Forgot your password?" on the sign-in form, entering your email, and following the verification link to set a new password — this is required because passwords could not be carried over during the migration. For questions, contact tips@streetsblog.org.