The Transportation Research Board’s 99th Annual Meeting will be held in Washington, D.C. from Jan. 12-16, 2020. Click here for more information.
The following article originally appeared on The Transport Politic. It is reposted here with permission.
It’s been a busy decade for many cities throughout the U.S. From coast to coast, they’ve been building up their transit networks, offering riders something more than run-of-the-mill bus routes.
Overall, American cities added more than 1,200 miles of new and expanded transit lines between 2010 and 2019, spending more than $47 billion in 2019 dollars to do so. They’ll continue making such investments into the 2020s, as I document on the interactive Transit Explorer website, and in The Transport Politic’s annual update article (coming later this month for 2020).
In this post, I’ll document those investments—but also show that they have been inadequate, at least so far, in stemming declining transit ridership in many U.S. cities.
First things first: What do I mean by improved transit service?
What I don’t measure here is perhaps the most important element of transit effectiveness: The frequency and speed of service. Trains and buses that show up more often and that travel more quickly are more useful, and thus more likely to be attractive to potential riders. Some, such as David Levinson, have developed effective measures of accessibility that measure how such services change over time. The costs of providing more frequent journeys are typical reflected in transit operating expenditures.
But what I do consider are the capital investments, in the form of new and extended transit lines, that can play an important role in dramatically improving peoples’ day-to-day transit experience. If done right, these investments can also actually improve the efficiency of transit operations by, for example, giving buses dedicated lanes so they can travel more quickly, or replacing a bus with a train that can fit more passengers.
Using data from Transit Explorer and available in this spreadsheet, I’ve documented all of the new and extended ‘quality’ transit lines in the U.S. completed from 2010 to 2019. By ‘quality’ I mean something more than a basic bus route.
I’ve categorized the investments made by U.S. cities according to their modes—arterial rapid transit, bus rapid transit, commuter rail, regional rail, metro, light rail, and streetcar.
To clarify, bus rapid transit projects include at least some dedicated lanes (such as Indianapolis’ Red Line), whereas arterial rapid transit projects (often marketed as BRT, such as Tulsa’s Aero BRT) often involve improved station amenities and better buses, but no dedicated lanes. Regional rail projects typically involve the creation of all-day, relatively frequent, two-way service (such as Denver’s A Line)—whereas commuter rail concentrates on peak-hour, inbound services.
As noted, U.S. cities added about 1,200 miles of quality transit services between 2010 and 2019.
Just over half of new miles added were through bus lines, with the rest added in the form of extended rail lines.
Of those rail projects, just 26 miles were in the form of metro investments—heavy-rail lines like new subways or elevated trains that often carry the most passengers through the densest parts of the country. And just 37 miles were in the form of streetcars, perhaps a surprising fact given the frequent discussion of that transportation mode’s deficiencies.
Rather, the majority of new rail projects in terms of mileage came in the form of either light rail or regional rail, two dependable, effective transit options.

The growth in mileage of quality bus lines has not been matched by the spending local, state, and national governments have dedicated to transit. Indeed, over the past decade, only about 8 percent of transit-expansion funds have been allocated to arterial rapid transit or bus rapid transit projects. The rest has gone to rail lines.
Whether this distribution of expenditures is a good or bad thing is a question that can be interpreted subjectively—rail projects may attract more riders, they typically provide a higher quality of service, and they’re typically faster and more reliable—but what is unquestionably true is that American cities have underinvested in expanded quality bus lines.
A total of about $3.6 billion was spent on new bus expansion projects over this period. That means the average American contributed just $1.10 in tax dollars annually to the construction of facilities for new or expanded quality bus lines, out of a total of about $14.50 every year on transit expansion overall.*
The average American consumer spent $8,427 on automobile transportation in 2016.

These costs, of course, do not include expenditures on transit operations, such as the salaries of drivers and the costs of fuel. Those costs often significantly outweigh those of capital investments. Nevertheless, it is unquestionable that Americans are spending very little to expand their bus systems. They’re spending a bit more on expanding their rail networks.
Whatever the distribution of new transit mileage and expenditures, how can we explain the fact that ridership on public transportation throughout much of the U.S. has declined substantially over the past decade? Shouldn’t all those new, higher-quality bus and rail routes have produced some positive outcomes in terms of ridership? And why are other countries seemingly capable of building transit ridership?
One explanation is that many new American transit routes are poorly designed, typically remain inadequately integrated into urban development projects, and focus more on low-density suburban areas than urban neighborhoods likely to attract more riders.
Yet another key cause is undoubtedly the continued investment of American cities and states in new roadways.
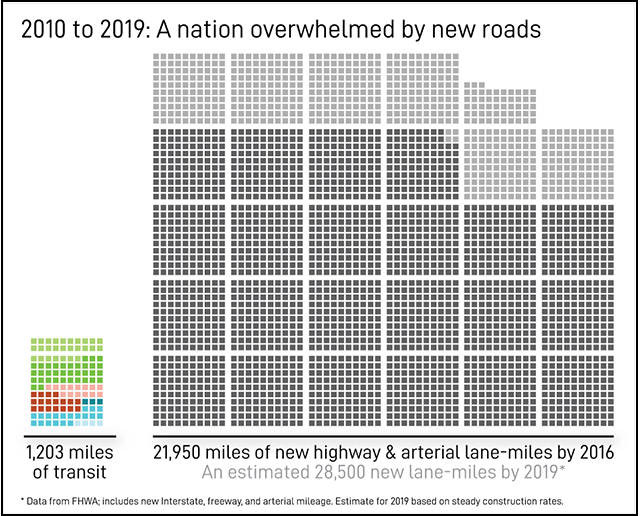
Even as the country was adding 1,200 miles of expanded transit service, it added an estimated 28,500 new lane-miles of arterials—roadways like Interstates, highways, and the four-plus-lane “stroads” that constitute many of our cities and suburban areas. This is infrastructure hostile to pedestrians and transit users—and likely to reinforce patterns of automobile dependency and sprawl.
That’s roughly 24 times as many new roadway miles as improved transit miles. Who can blame Americans for continuing to drive? Transit offerings simply have not kept up.

Ceasing the continuing expansion of the public roadway network is an essential element of any effort to reduce the carbon footprint of transportation, which is now the single-largest contributor to American greenhouse gas emissions.
From this perspective, it should be concerning to U.S. policymakers that, not only do Americans contribute about 3.6 times as many carbon emissions per capita as their peers in countries like France, but also that per-capita emissions in the U.S. fell by only 21 percent between 1980 and 2014, versus by 50% in France.
If the American addiction to the automobile has been aided and abetted by the growth in roadways, it has also been encouraged by inadequate construction of new and expanded transit lines, at least from a relative perspective.
Below, consider the mileage added to quality public transit networks in the U.S., Canada, and France between 2010 and 2019, which I’ve divided up between bus investments on the left and urban rail investments on the right (I have not included regional or commuter rail in this calculation because of inadequate data from France).
In both cases, U.S. cities added roughly similar mileage compared to their peers in France, and significantly more than cities in Canada. So far, so good.

But it won’t escape readers’ understanding, of course, to recognize that the U.S. is in fact far more populous than either Canada (1/9th as large) or France (1/5th as large).
Indeed, when adjusting those investments in new transit mileage to each country’s population, all those new projects in the U.S. seem depressingly modest.
Over the past decade, U.S. cities added an average of fewer than 2 miles of urban bus improvements per million inhabitants—and fewer than 1 mile of rail improvements. France, meanwhile, gained more than 10 and 3, respectively.
Let’s now consider just those projects with dedicated lanes—in other words, excluding streetcar and arterial rapid transit lines. Dedicated-lane transit expansions are most likely to actually improve peoples’ commuting habits because they’re less likely to get stuck behind traffic.
On this count, shown on the red, rightmost section of the following chart, the U.S. has fallen truly behind these two peers. Over the past decade, it produced less than one-fifth the dedicated-lane transit mileage as France on a per-capita basis, and about 50% less than Canada.

We’re left with a dismal portrait of transit expansion in the U.S.—especially since, compared to most other developed countries, it already had poor transit offerings in 2010.
Despite 1,200 miles of new transit lines, states and cities in the U.S. have added far more mileage to their roadways. Despite tens of billions of dollars in expenditures, U.S. cities have increased their transit systems less substantially than cities in Canada and significantly less than those in France. The U.S. has a lot of work to do if it wants to encourage more transit ridership and identify mechanisms to reduce transportation-related greenhouse-gas emissions.
The good news that that American residents are, from a comparative perspective, spending very little on investing in transit-system expansion through new lines and the extension of existing lines.
It’s true that American transit projects are significantly more expensive to build than those outside the U.S., especially in cities like New York and San Francisco. Indeed, if costs were lower, we could build more. But we’re still dedicating very little of the public purse to new and expanded lines.
Every reasonably sized city in the country should be identifying corridors for bus rapid transit, reallocating street space for that purpose, and ceasing roadway expansion. The speed of implementing such improvements has been far too slow given the poor quality of most bus service throughout the country and the relatively low cost of making such changes.
But that requires cities to take seriously their responsibility to find the means to get people out of their cars. It requires activists to make the case that the era of automobile dominance must come to an end.
The federal government, meanwhile, should expand its support for new busways and rail lines, dramatically increasing the share of Americans with easy access to high-quality transit lines.
In today’s climate, such a proactive agenda has no real political legs in Washington—it would be very unlikely to pass the Republican-controlled Senate, let alone be proposed by President Trump. But there’s an election in 2020.
For further information about the projects in the U.S. and Canada examined in the writing of this article, the database of projects is available here.
* It is worth noting that these figures are in estimated 2019 dollars, based on the midpoint of the construction period of each line. Also, I do not include projects that were under construction between 2010 and 2019, but which will not open until 2020 or later. This means that the figures quoted in this article represent spending only on projects that were completed between 2010 and 2019; thus spending occurred in a period roughly ranging from around 2005 to 2019.
Yonah Freemark is a native of Durham, North Carolina and is currently a doctoral candidate in the Department of Urban Studies and Planning at the Massachusetts Institute of Technology (MIT). He studies how local governments shape planning outcomes in the context of political conflict and multi-level governance systems, engaging this subject from the perspectives of transportation projects, urban design, land-use policy, and affordable housing development in the United States and Europe. He is the founder and writer of The Transport Politic.


