BTS Releases Confusing, Erroneous Transit Stats
I was all set to write a feel-good story about how the latest report from the Bureau of Transportation Statistics [PDF] shows that transit ridership is up and driving is down. I made up my mind to write that story before I even looked at the report, so sure was I that that was the message.
And that is still the message. But BTS’s numbers are awfully confusing.
Let’s start with this:
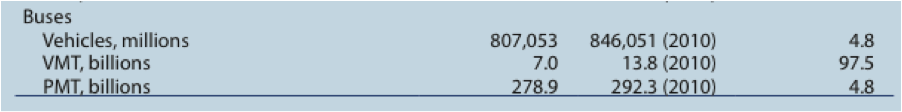
Wait a minute, let me get this straight. There are 4.8 percent more commercial (inter-city) buses in 2010 than there were in 2005. Considering how BoltBus and MegaBus have revolutionized inter-city bus service, making it the fastest-growing travel mode, 4.8 percent growth in five years seems a little stingy. Other reports have put it at 6 percent growth just from 2009 to 2010.
But even assuming that 4.8 percent is correct: A 4.8 percent growth in passenger miles traveled makes sense, although I might expect the growth in the mode to mean fuller buses, meaning a greater growth in PMT than number of vehicles. But it’s the 97.5 percent change in vehicle-miles traveled that I cannot fathom. That would indicate that a few buses are driving around an awful lot without a lot of people on them.
Turns out BTS simply got the number wrong. According to FHWA, where all this data supposedly comes from, there were 148 billion passenger-miles-traveled on buses in 2005 and 292 billion in 2011 — meaning passenger miles have almost doubled, along with vehicle miles.
For what it’s worth, FHWA reports the 2011 total number of private and commercial buses at 311,790.
Moving on to urban transit:
So transit bus coverage has grown by an astonishing 39 percent over six years but there are actually fewer buses driving all those miles? Passenger miles have risen just 6 percent for those 65,000 additional bus miles? And the number of trips has actually gone down?
I’m no great quantitative data analyst, but these numbers make no sense.
It’s possible that transit systems all over the country have re-prioritized coverage over ridership in their bus service, but probably not by this much.
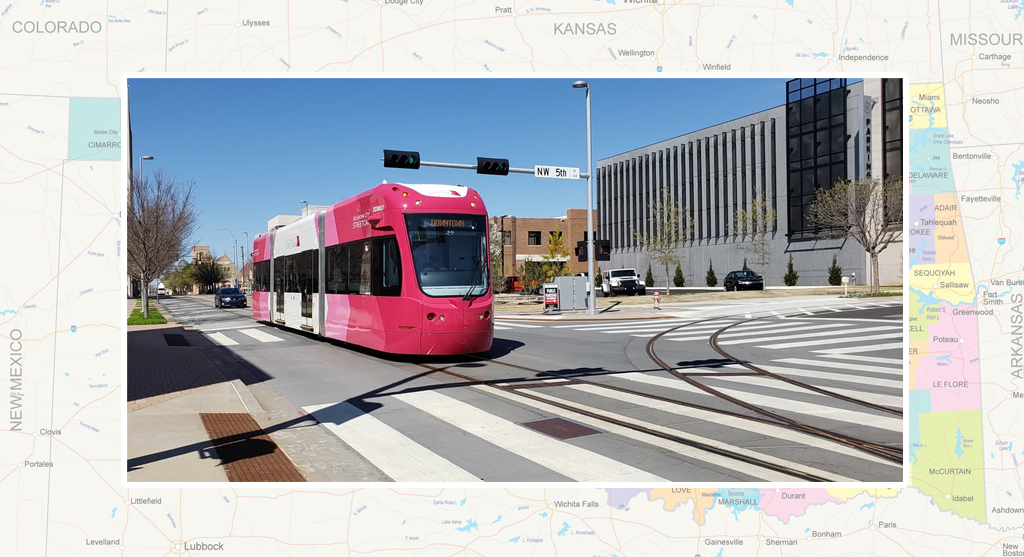
But perhaps this is where we get to the rah-rah part of our story. Light rail has grown by 46.5 percent, thanks to big extensions in Denver, Salt Lake City and Dallas and new systems in San Diego and Phoenix. This big light-rail push has led to a 39 percent growth in passenger-miles-traveled. Meanwhile, commuter rail and heavy rail ridership is up 20 percent.
Now Amtrak:
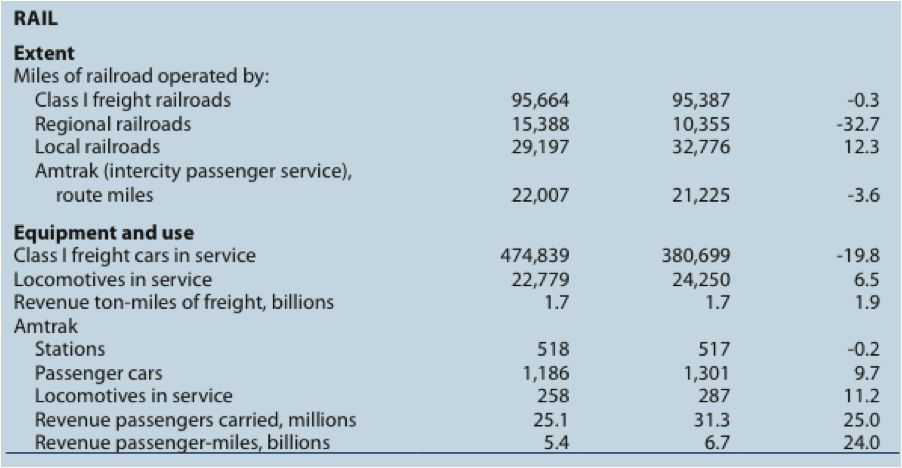
The Amtrak system shrunk by about 780 miles in 2005, when Hurricane Katrina damaged the New Orleans-to-Orlando segment of the Sunset Limited line, and it’s never been reopened. Since 2011, however, Amtrak has made up some of those miles by extending service in Maine and Virginia.
The Sunset Limited is Amtrak’s lowest-ridership long-distance line, so maybe shortening it wasn’t the worst thing in the world (although a spokesperson for the rail company notes that service there is still suspended, not permanently cut). No matter what, Amtrak sure is doing something right: It now carries 25 percent more paying riders than in 2005. (Ridership in 2012 was about the same as the 2011 number shown here.)
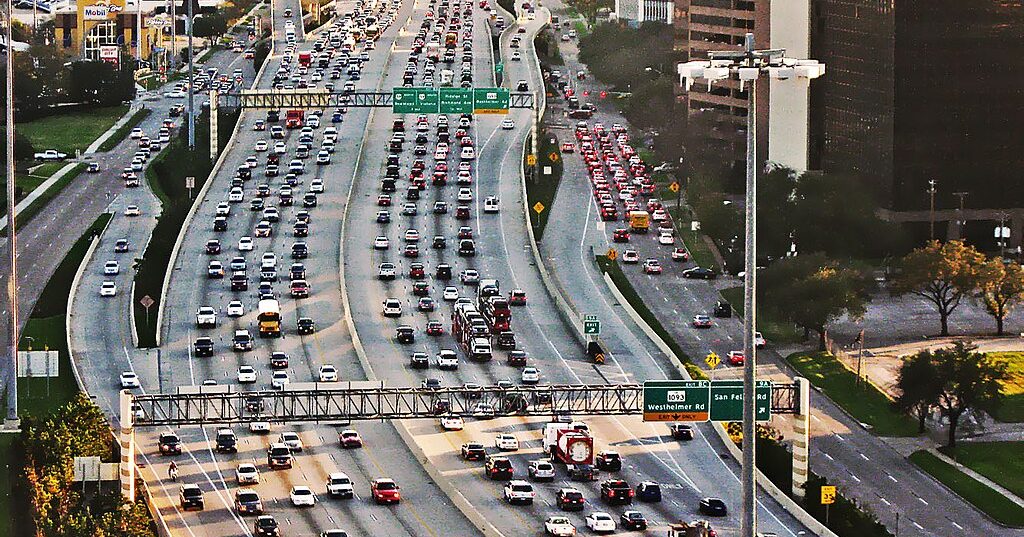
Meanwhile, as we’ve amply reported, people drove 3.7 percent less between 2005 and 2011. Passenger miles dropped far more, by 15.6 percent. Does that mean there are fewer vehicles on the road (0.6 percent fewer, in fact) but more of them are single-occupancy? One thing is clear: the dip in driving means there was no reason to build 200,000 more lane miles during that time.

Streetsblog has migrated to a new comment system. New commenters can register directly in the comments section of any article. Returning commenters: your previous comments and display name have been preserved, but you'll need to reclaim your account by clicking "Forgot your password?" on the sign-in form, entering your email, and following the verification link to set a new password — this is required because passwords could not be carried over during the migration. For questions, contact tips@streetsblog.org.