Step one: Do it like Indianapolis.
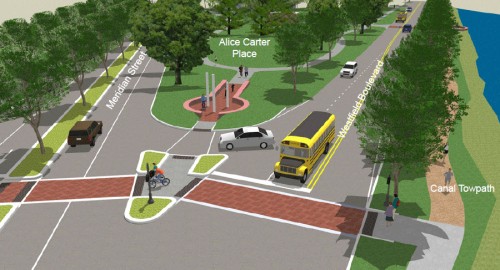
Of the 130 complete streets policies passed in 2012, the one passed by Indianapolis gets the highest score in a new ranking by Smart Growth America and its National Complete Streets Coalition.
“The Complete Streets movement fundamentally redefines what a street is intended to do, what goals a transportation agency is going to meet and how a community will spend its transportation money,” the Coalition writes in its report ranking last year’s policies.
Complete Streets policies challenge auto-centric design and entrench an ethic that streets are for all users, of all ages and abilities, on all modes. A street designed for cars to travel at top speeds without regard for pedestrians, bicyclists, or public transit users – now or in the future – is not a complete street.
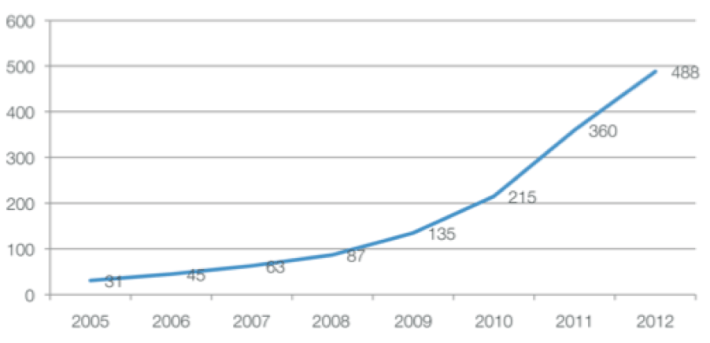
Last year was a good one for advocates of these policies: Of all the 488 policies currently in place nationwide, more than a quarter of them were passed last year.
Statewide policies exist in 27 states and the District of Columbia and Puerto Rico. You might be surprised by the states with the most policies – Michigan leads the pack with 65 policies, then New Jersey with 50 and in third place – shockingly – is Florida, the most dangerous state in the nation for pedestrians and bicyclists.
Though Indianapolis leads the Coalition’s ranking, a mix of smaller and mid-size cities round out the top 10, highlighting the diversity of places well suited to complete streets. Lightly-populated suburban communities make up 37 percent of municipalities with policies. Small towns represent another 20 percent.
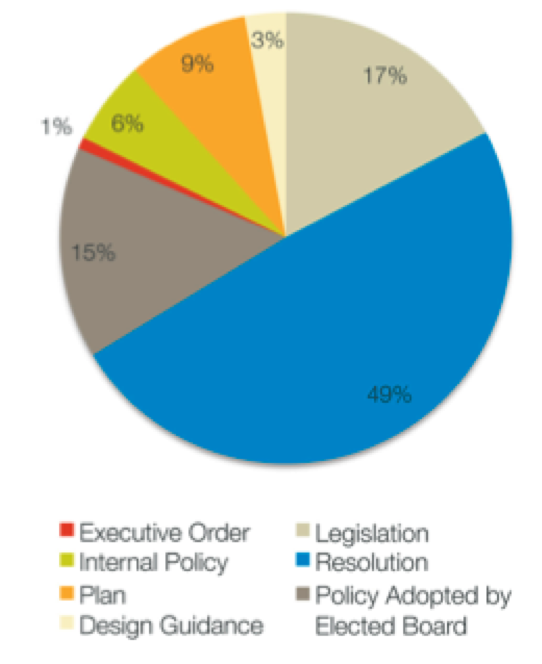
Policies can take the form of “legislation, resolutions, executive orders, departmental policies, policies adopted by an elected board, plans and design guidance,” the Coalition said. Disappointingly, these differences aren’t reflected in the rankings. Nearly half of the complete streets policies passed to date have been in the form of non-binding resolutions, with just 17 percent being codified in legislation. The report did, however, give points for language saying changes that “shall” or “must” be made, rather than that merely promoting those that “may be included” or “will be considered.”
The Coalition also seems to be agnostic on the question of how users are accommodated. The report spotlights Portland, Maine’s policy, commending it for being specific about what design guidance it wants to use – and Portland’s policy names three AASHTO guides before getting to more progressive ones put out by the National Association of City Transportation Officials or the Congress for the New Urbanism and the Institute of Transportation Engineers. That means cutting-edge street designs like separated bicycle lanes could get forgotten even as cities strive to do the right thing to protect cyclists and pedestrians.
So what makes for a good complete streets policy? The Coalition lays out its criteria:
Vision and intent: The policy outlines a vision for how and why the community wants to complete its streets.
It’s too soon to judge these policies based on how much the streets have changed, though the Coalition does give a point – yes, just one point – to “policies that change the way transportation projects are prioritized and thus chosen for funding and construction.” It seems that if a policy has achieved that, it’s reached the holy grail.
Whether or not progress from last year’s policies can be ascertained, the best policies establish clear and concrete criteria to judge future success. In Indianapolis, the city pledges to quantify bike lane mileage, pedestrian accommodation, new curb ramps, crosswalk and intersection improvements, transit stops accessible via sidewalks and curb ramps, crash rates by mode, and the rate of children walking or bicycling to school. Clearly, policies that have the full force of the law behind them, whether passed by legislation or executive order, will produce more impacts than those that are nothing more than nonbinding resolutions.
The top 10 policies were created by:
- Indianapolis, IN
- Hermosa Beach, CA (tie)
- Huntington Park, CA (tie)
- Ocean Shores, WA
- Northfield, MN
- Portland, ME
- Oak Park, IL
- Trenton, NJ
- Clayton, MO
- Rancho Cucamonga, CA
