How Walkable Are the Streets Near Your Transit Stop?
Allow me to speak for the Streetsblog Network as a whole when I say, everyone is excited about the Center for Transit Oriented Development’s new national database.
This tool provides demographic and economic information about areas surrounding all of the nation’s 3,768 existing and 843 proposed fixed-guideway transit stations. It’s intended to “help developers, investors, and city officials make planning decisions that take advantage of development opportunities around transit nodes,” CTOD said in its announcement. The database should help shift development decisions from the car-based, interstate interchange mindset to criteria that will accelerate the movement toward building walkable, sustainable urban places.
You can also do some nifty data crunching. Want to see how many people live near an El station in Chicago? Now, the answer is just a few key strokes away, points out Elevating Chicago.
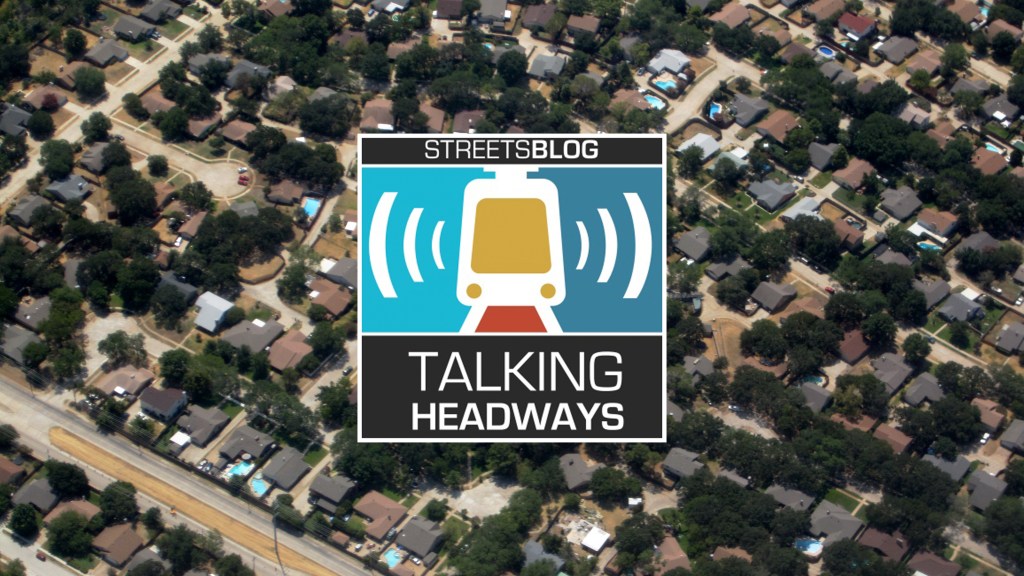
At individual transit sites, however, the usefulness of the database can depend on the location. As Network blog Walkable Dallas-Fort Worth explains, when you look closely, the areas within walking distance of a transit station don’t always match what appears in the database:
Each of these TOD zones requires specific attention to detail. This gets at a broader problem preventing TOD planning from becoming smarter, and that is the ubiquitous 1/2-mile walk circle.

The issue with the 1/2-mile circle, intended to simulate a 10-minute walk or a popularly accepted distance to travel by foot to transit stations is that not all 10-minute walks are the same. What is the road network like within that 1/2-mile generic circle? How many roads must be crossed? How direct is the route (yielding a more radial pattern emanating from a center of gravity or attractor – in this case the transit station)? Are there highways to be traversed? How long is the wait to cross at crosswalks, etc. etc.?
As you can see (image right), what actually constitutes an acceptable walking distance is FAR, FAR smaller than the 1/2-mile circle, because it takes a similar amount of time.
Maybe, with some tweaking, this can turn into another benefit of the database: highlighting all the places where re-configuring streets can increase the area served by transit.
Elsewhere on the Network today: The Transport Politic looks at L.A.’s long-overdue proposal to extend subway service down Wilshire Boulevard to Santa Monica. Bike Portland, reporting from Railvolution, asks if Bike-Oriented Development is the new Transit-Oriented Development. The City Fix examines transit systems’ responsiveness to growing digital feedback from the public, made possible through the explosion in social media.

Read More:
Streetsblog has migrated to a new comment system. New commenters can register directly in the comments section of any article. Returning commenters: your previous comments and display name have been preserved, but you'll need to reclaim your account by clicking "Forgot your password?" on the sign-in form, entering your email, and following the verification link to set a new password — this is required because passwords could not be carried over during the migration. For questions, contact tips@streetsblog.org.