Mapping How Far You Can Bike Without Breaking a Sweat

Any bicyclist knows that maps can be quite deceiving at first glance. The first time I tried to traverse San Francisco on a bicycle, I foolishly set out from the bike-rental shop on Fisherman's Wharf with a basic street map, and decided that I'd avoid downtown traffic by heading south across the grid. While I was correct that the city's connected street grid offered many direct routes, I neglected to notice the huge ridge of Pacific Heights looming directly ahead, or the numerous full-stop intersections along the way that would further sap my momentum.
University of Maryland professor Hiro Iseki also appreciates how a substantial climb can turn a pleasant ride into a hard slog. On his bike commute, "one last segment of University Boulevard, on the west side of the campus, is the hardest part for me -- not just because of the slope, but because of the traffic." Together with former graduate student Matthew Tingstrom, who first suggested the topic in a class, Iseki has used GIS analysis to analyze how overlapping factors might affect how far bicyclists are willing to travel. These maps can identify routes and destinations that require a similar amount of effort to cycle to, and offer an opportunity to find routes that won't leave cyclists drenched with sweat.
Planners define a "bikeshed" as the area that's easily bikeable from a given place, similar to how a watershed is the area from which water flows to a given place. Defining the parameters of "easily bikeable" can take into account many different and overlapping factors. The "travel impedance" factors that Iseki has overlapped include distance, terrain, and street connectivity. Many available mapping applications measure distance, like Walk Score, and some also measure vertical distances, like GoBikeBoulder or MapMyRide, but few have quantified connectivity's impact on travel routes.
Interestingly, both terrain and connectivity can both help and hinder how far a bicyclist might travel. For every downhill, there's an equivalent uphill; meanwhile, greater connectivity decreases distances between points, but also introduces more intersections. Iseki says that on balance, street connectivity is great for bikeability, "but at the same time riders have to stop at intersections." He said that he "was curious about how stopping at intersections impacts the energy assumptions, which could potentially influence the way that people get around."
The research was recently presented as part of the university's Smart Growth webinar series and at 2013's Transportation Research Board annual meeting, and is currently under review for publication.
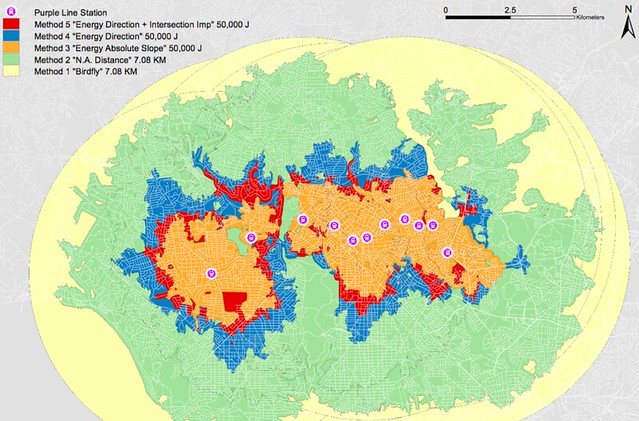
Iseki takes as a baseline 50,000 Joules of energy, which is the energy expended during an easy, seven kilometer (4.43 mile) non-stop bike ride across flat terrain. (A typical bike commute in the United States is of approximately that length.) The same amount of energy would take the same rider a shorter distance uphill, and even less distance if the rider also has to wait to cross busy streets. Iseki's model calculates the number of full stops, and thus efforts to regain speed, necessary at each potential right or left turn, from or onto a busy street. Each of these turns, he calculated, eats anywhere from 367 to 1466 additional Joules of energy compared with not stopping.
Applying these impedance factors to the bikesheds around test locations shows that many nearby areas might be difficult to reach by bike -- whether because streets don't connect there, hills get in the way, or too many stops would be required. For instance, the imperfect street network around the test locations puts about 40 percent of the area out of reach, compared with a (theoretical) flat, non-stop, straight-line bike ride, since streets don't connect across gaps like rivers or railroad tracks.
Overlapping more impedance factors further reduces the area that's within an easy bike ride. In relatively flat and gridded Bethesda, factoring in hills shrinks the bikeshed by 83 percent, and adding in stops at intersections shrinks it by 90 percent. In the hillier and less contiguous neighborhood of Lyttonsville, topography shrinks the bikeshed by 93 percent, and together with intersections reduces the bikeshed by 96 percent.
While topography is by far the largest factor that gets in bicyclists' way, intersections have a huge impact. In both the Bethesda and Lyttonsville cases, bicyclists could access 70 percent more destinations if it weren't for the constant stops and starts demanded by major intersections.
The research uses as its test bed several neighborhoods along a forthcoming light rail line running across Montgomery County, Maryland, just north of Washington, DC. Iseki suggests that the analysis might be a good starting point for mapping out new Capital Bikeshare docks, as that system expands throughout Montgomery County.
Not much can be done about Maryland's rolling hills, but Iseki notes that policy reforms can ease the way across intersections. He points out that one inspiration for his research were the bike boulevard routes in Portland, which "make it easy for a bicyclist to travel throughout the city" by "eliminating stops and keeping continuity of bike paths." Of course, another policy, the Idaho stop, could also considerably smooth the path for cyclists.
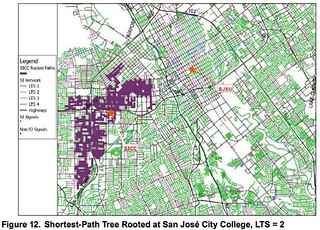
Although Iseki's research did not factor in the area's bikeway network, he noted that his methods were complementary to those used by another study team that examined "low traffic stress" bike routes within citywide street networks. In the Mineta Transportation Institute's 2012 report "Low-Stress Bicycling and Network Connectivity," Maaza Mekuria, Peter Furth, and Hilary Nixon found that 64 percent of San Jose's streets were within "islands of low traffic stress connectivity." These "islands" had calm, safe streets suitable for a wide population of cyclists, but were separated by "high stress" streets with lots of fast-moving traffic.
Combining the two GIS research methods, as Iseki hopes to do, could map out opportunities for cyclists to connect around hills and across busy intersections -- and yield even more insights about how to create bike routes that leave cyclists smiling, rather than sweating.
Stay in touch
Sign up for our free newsletter
More from Streetsblog USA
Thursday’s Headlines Don’t Like Riding on the Passenger Side
Can you take me to the store, and then the bank? I've got five dollars you can put in the tank.
Study: When Speed Limits Rise on Interstates, So Do Crash Hot Spots on Nearby Roads
Rising interstate speeds don't just make roads deadlier for people who drive on them — and local decision makers need to be prepared.
Calif. Bill to Require Speed Control in Vehicles Goes Limp
Also passed yesterday were S.B 961, the Complete Streets bill, a bill on Bay Area transit funding, and a prohibition on state funding for Class III bikeways.
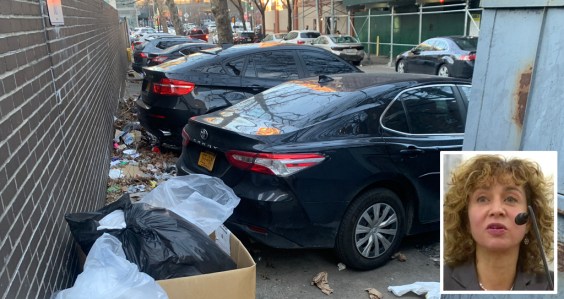
Under Threat of Federal Suit (Again!), NYC Promises Action on ‘Unacceptable’ Illegal Police Parking
A deputy mayor made a flat-out promise to eliminate illegal police parking that violates the Americans With Disabilities Act. But when? How? We don't know.
Legendary Chicago bicycle traveler and writer George Christensen killed by truck driver in South Carolina
As a longtime bicycle courier, and one of Chicago’s most adventurous bike riders and writers, George Christensen did extensive cycling trips in Africa, Asia, Australia, Europe, North America, and South America. Learn more about his legacy.