Op Ed: The Most Important Bike Tech is…Street Design
Recent years have seen a surge in bicycle technology as transformative as anything since the penny-farthing gave way to the safety bike. Bike-share systems provide access to bikes without the troubles of parking or storage. Electric bikes boost the length of an acceptable ride far beyond what two tired legs might muster. Bike counters can help transportation agencies evaluate past upgrades and plan for future ones.
But for all these advances, it’s a humble bit of street design that still holds the key to unlocking more riders in cities: bike lanes that keep riders safely separated from cars. Two new case studies — one in Lisbon, one in Toronto — offer the latest (though hardly the first) evidence of the power of bike infrastructure to encourage cycling. The work underscores that no one technology can replace the basic need to feel safe on city streets.
It also speaks to the perils of relying on historical data alone to guide important policy decisions.
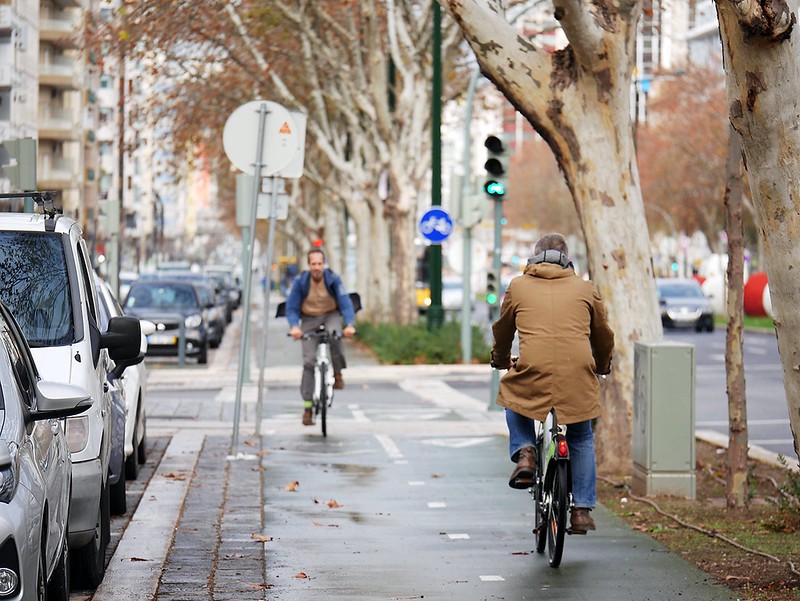
Lisbon’s ‘game-changing’ infrastructure
A decade ago, cycling wasn’t very popular in Lisbon, Portugal. One travel survey from 2011 found that city residents made just 0.2 percent of trips by bike, far below the European Union average around that time of 8 percent. Today, bike use in Lisbon is on a steady rise, but the reason isn’t that residents suddenly decided they like to ride. Instead, Lisbon built safe bike infrastructure despite the low numbers, and the riders came.
Three University of Lisbon researchers (Rosa Félix, Paulo Cambra, and Filipe Moura) track this evolution in a new paper from the June issue of the journal Case Studies on Transport Policy. Lisbon’s shift began in 2016, when the city announced significant investments to address the challenges facing cyclists. A year later, Lisbon began rolling out 100 kilometers (62 miles) of bike lanes separated from car traffic along key commuting routes to help keep riders safe. And in it launched a bike-share system with 1,400 bikes — most of them e-bikes — to help riders struggling with storage or the city’s hills.
The researchers used the sequential nature of the plan to figure out just how much of a role each intervention (bike lanes and bike-share) played in the rise of cycling. They gathered baseline data in 2016 from seven areas: three in central locations where the upgrades would later occur, two in adjacent central neighborhoods that might benefit from upgrade spillover, and two in “control” areas outside the central district that would not receive upgrades. They collected ridership data in 2017, after the bike lane expansion began, and again in 2018, after the bike-share system launched.
The combined impact of the interventions was clear. In the three central locations, cyclist volume during rush-hour experienced a 17-fold increase from 2016 to 2018, going from roughly 19 average riders per hour to 325. When adding in the two adjacent central areas, the ridership increase averaged a whopping 817 percent. While the control areas did experience a notable rise in bike use (69 percent), these gains were far below those found in the primary intervention areas (though they do suggest a general cultural shift across the city).
The researchers called the combination of separated bike lanes and bike-share options a “game-changer.”
The results suggest that such interventions are a game-changer to start the process of a city’s progression towards higher cycling maturity levels, especially if they are implemented in a city with almost no cycling modal share, such as our case study.
But while both interventions played a role in the cycling rise, the infrastructure upgrades were the bigger catalyst for change, according to the study. Across the five central areas (core and adjacent), the researchers attributed a 3.5-fold increase in cyclist volume to the bike lane expansion, and only a 2.5-fold increase to the bike-share system.
On this point, the data in the two intervention-adjacent areas are especially telling. In one of these adjacent areas, which already had its own bike lane, bike-share did indeed boost ridership. But in the other adjacent area, with no separated bike lane, ridership actually declined from 2016–2018; riders flocked to the safety and comfort of the new lanes in adjacent areas, even if that meant straying a bit from their most direct travel route.
So bike-share access alone — and e-bike access at that — wasn’t enough to get Lisbon residents on wheels. They had to feel safe first. In places where bike-share stations were available but dedicated bike lanes were not, “there was not a significant increase in the cycling volume,” write the researchers. “These findings corroborate the necessity to overcome the barriers associated with safety perception … as a pre-requisite to increasing cycling levels.”
For all the tech advances of on-demand bike-share and e-bikes, it was street design that moved the city forward.
Toronto’s cyclists in waiting
Studies like the one in Lisbon are further evidence that safe cycling lanes should be part of a city’s basic infrastructure — something that’s accessible to everyone, not just certain neighborhoods. But from a practical perspective of limited resources (and, for some cities, political will), it can help to identify which areas are best suited for a cycling surge with the proper infrastructure in place.
That’s where the second recent study — this one focused on Toronto — comes into play. The work, which appears in the International Journal of Sustainable Transportation, comes via researchers Mischa Young, Beth Savan, and James Scott of the University of Toronto, and collaborator Kevin Manaugh from McGill University.
For the study, the research team collected data on more than 500 designated “traffic zones” across Toronto. They gathered an array of behavioral, demographic, and environmental metrics that might account for cycling trends, including a household’s number of short daily trips (less than 4 kilometers), the number of cars it owns, the area’s population density, the existence of bike infrastructure, and more.
When the researchers analyzed the factors, they found that bike infrastructure did play a significant role in cycling trends. For every 1 kilometer of painted bike lanes or cycle tracks in a designated traffic zone (or an adjacent area, since cycling spills over into neighboring places), their analysis predicted a 0.4 percent increase in the share of total trips made by bike. Similarly, for every 1 kilometer increase in cycling signage in a zone (or an adjacent area), the analysis predicted a 0.9 percent increase in total trips by bike.
Together, that’s a potential increase in total trips by bike of 1.3 percent, courtesy of better cycling infrastructure. If that figure seems small, keep in mind that across the City of Toronto as a whole only, bikes account for only 2.8 percent of trips. So it’s not a stretch to suggest that good infrastructure is nearly half the cycling battle.
The study didn’t stop there. Instead, the researchers took all the factors in their analysis and created a model of bike use in every traffic zone. Using that model, they calculated which zones had a hidden potential for cycling: places where the theoretical model predicted more cycling than actually found in the real-world data. Their point was that cities shouldn’t just invest in places where cycling is high; rather, cities should invest in places where cycling would be high given the right infrastructure — just like Lisbon did in its city center.
Take the Shawnee Park area of the Toronto region. Shawnee Park is located 20 kilometers northeast of Toronto’s city center, in the suburbs of North York. According to real-world survey data, Shawnee Park has basically no cycling trips. But according to the model built for this study, 3.3 percent of all trips in Shawnee Park should be made by bike. That gap between prediction and reality is the hidden demand.
Many factors in Shawnee Park make it ripe for cycling. Nearly 41 percent of all trips in the area are short trips (less than 4 kilometers), which is above average for Toronto as a whole. Shawnee Park households also own fewer cars than Toronto on average (roughly 1.6 to 2, respectively). And Shawnee Park is near regional public transportation hubs, with 20.5 percent of trips made by transit, just a bit below the Toronto average.
The big thing Shawnee Park lacks is bike infrastructure. Shawnee Park is penned in by highways that are difficult to cross on a bike, and its nearby transit stations are hard to reach by bike as well. Without safe bike infrastructure, residents can’t reach transit or the destinations for their many short daily trips without using a car. The researchers conclude that investing in separated bike lanes and other cycling infrastructure to increase the connectivity of Shawnee Park could unlock its full potential:
A careful analysis of this area uncovers its untapped cycling potential, and emphasizes how a few targeted investments in cycling infrastructures and programs can likely lead to cycling adoption.
The limits of historical bike data
These two cases share a common thread beyond the impact of infrastructure. Both also serve as reminders of the limits of historical data when it comes to improving urban life.
If Lisbon had used pre-2016 cycling volume alone to guide its transportation policy, it might have decided not to improve bike infrastructure, under the faulty reasoning — often embraced by cycling and transit opponents — that it’s not worth investing in something that few people use. Similarly, if Toronto only upgrades bike infrastructure in downtown areas where cycling is already thriving, it won’t unleash the full potential of cycling across the metro area. (To this point, the Toronto study found no statistical link between population density and bike trips, further underscoring the importance of basic infrastructure.)
In other words, viewing baseline data in isolation can obscure the bigger picture. For many city residents, the primary barrier to riding a bike is not that they don’t like to ride — it’s that they don’t feel safe doing it. An automated cycling counter can show how many people ride a bike down a given street, but it can’t show how many people would ride if a separated bike lane made them comfortable and welcome on the street. The baseline data is a useful input, but on its own, the story it tells is incomplete.
To fill out that story, you need a deeper understanding of how cities have designed streets to prioritize vehicle traffic above all other travel modes for more than a century. Seen through that lens, it’s perfectly clear why cycling volumes are often so low before safe bike infrastructure is put in place; discouraging bikes was a street design feature, not a bug. Ignoring that greater context of urban design risks perpetuating the faults built into the system or pursuing the wrong solutions.
That’s not to say baseline data isn’t helpful. As the Lisbon and Toronto cases show, it can be used to demonstrate the power of design changes on cycling behavior, to document the benefits of a public investment over time, and to identify underserved areas that blanket policies might overlook. But treating historical data as an infallible policy guide can quickly lead a good intention down an unsafe path.
Eric Jaffe (@sidewalklabs) is the editorial director of Sidewalk Labs. This article originally appeared on Medium is republished with the permission of the author.

Read More:
Streetsblog has migrated to a new comment system. New commenters can register directly in the comments section of any article. Returning commenters: your previous comments and display name have been preserved, but you'll need to reclaim your account by clicking "Forgot your password?" on the sign-in form, entering your email, and following the verification link to set a new password — this is required because passwords could not be carried over during the migration. For questions, contact tips@streetsblog.org.