There is some good news, at least.
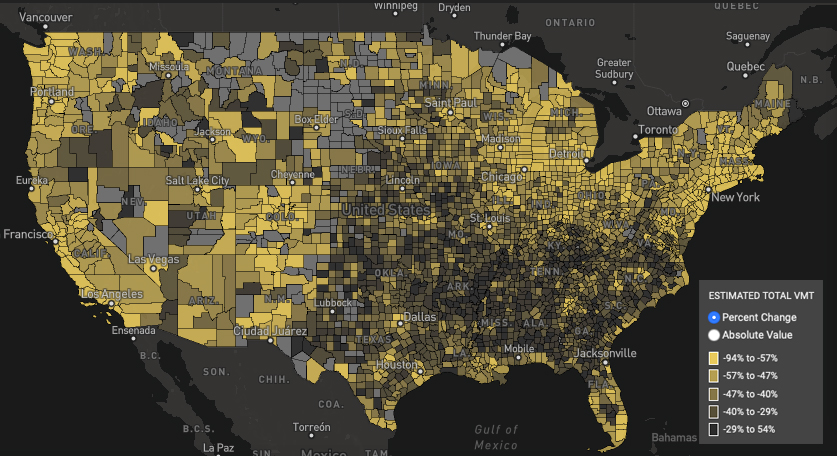
Americans are indeed driving less — up to 94 percent less in some places — as the global COVID-19 pandemic keeps people at home, but rural segments of the country are not doing their share to flatten the curve, the result of a patchwork of rules set in statehouses rather than at the White House.
New vehicle miles traveled stats released today by StreetLight Data and Cuebiq, which compiles cellphone location data, confirm what everyone has been seeing anecdotally — that driving is down — but it's not down consistently.
The national map (above and linked here) shows that driving has decreased by far less across a wide portion of the American southeast — where mandatory stay-at-home orders have been issued late. As such, we've thrown in a few representative cities at the bottom of this story. (The 94-percent drop is a bit of a statistical anomaly; it's from Nantucket, Massachusetts, which, being an island, doesn't get a lot of pass-through traffic.)
There are also some small rural counties where driving has increased during the crisis. In Big Horn county, Montana, driving is up 8 percent. In Harlan County, Century, it's up 46 percent. In Jackson County, Tennessee, it's up 54 percent.
Local governments around the country will likely use the data to project shortfalls from such revenue sources as tolls and gas taxes, but the same municipalities could use the regularly updated information to compare residents' movements to the spread of the illness.
“Transportation professionals make critical budget and planning projections based on gas tax revenue and other factors derived from VMT,” said Laura Schewel, CEO and co-founder of StreetLight. “The recent massive drop in travel is throwing off all those plans."
All VMTs presented below are from StreetLight/Cuebiq. The percent change reflects the delta in daily VMT between the given dates in March and a baseline date in January, 2019. Also, Streetsblog's headers below mention the main city in a given region, but the VMT data reflects that of the entire county that contains the given city (exception, New York City, which comprises five counties).
San Francisco
The Golden Gatee City has been subject to a stay-at-home order since March 16, which is well ahead of other areas.
March 2: 14,700,000 miles (5 percent off January, 2019 average)
March 27: 2,450,000 miles (84 percent off January, 2019 average)
Total March decrease: 83 percent.
Los Angeles
Like San Francisco, L.A. has been under a statewide stay-at-home order since March 19.
March 2: 221,000,000 miles (7 percent off January, 2019 average)
March 27: 66,600,000 miles (72 percent off January, 2019 average)
Total March decrease: 70 percent.
Chicago
Chicago has been subject to Illinois's statewide stay-at-home order since March 21.
March 2: 140,000,000 miles (3 percent above January, 2019 average)
March 27: 45,600,000 miles (66 percent off January, 2019 average)
Total March decrease: 67 percent.
Denver
The Mile High City issued its stay-at-home order on March 24, two days before the state.
March 2: 22,300,000 miles (10 percent above January, 2019 average)
March 27: 5,130,000 miles (75 percent below January, 2019 average)
Total March decrease: 77 percent.
New York
New York's five boroughs (counties) have been covered by the state's stay-at-home order, which went into effect at 8 p.m. on March 22.
March 2: 111,900,000 miles (16.5 percent below January, 2019 average)
March 27: 30,840,000 miles (77 percent off January, 2019 average)
Total March decrease: 67 percent.
Boston
The Hub is not covered by a stay-at-home order, though Massachusetts Gov. Charlie Baker has advised people to stay at home as of noon on March 24. "The Baker-Polito Administration does not believe Massachusetts residents can be confined to their homes and does not support home confinement for public health reasons," the governor's office said in a statement that is still in effect.
March 2: 13,500,000 miles (11 percent below January, 2019 average)
March 27: 3,370,000 miles (78 percent below January, 2019 average)
Total March decrease: 75 percent.
Washington, D.C.
The nation's capital's stay-at-home order took effect on April 1.
March 2: 12,800,000 miles (19 percent below January, 2019 average)
March 27: 2,870,000 miles (82 percent below January, 2019 average)
Total March decrease: 77 percent.
Seattle
Washington Gov. Jay Inslee declared a state of emergency on Feb. 29, but a stay-at-home order did not take effect until March 23.
March 2: 48,000,000 miles (8 percent below January, 2019 average)
March 27: 9,830,000 miles (81 percent below January, 2019 average)
Total March decrease: 79 percent.
Montgomery, Ala.
Alabama was one of the last states to issue a stay-at-home order, which took affect on Saturday, April 4. Gov. Kay Ivey acted only after the state's largest city, Birmingham, issued its order on March 24.
March 2: 13,800,000 miles (6 percent below January, 2019 average)
March 27: 9,280,000 miles (37 percent below January, 2019 average)
Total March decrease: 32 percent.
Jacksonville, Fla.
Florida was also late in issuing a stay-at-home order, which took affect on April 3.
March 2: 49,600,000 miles (1 percent below January, 2019 average)
March 27: 26,500,000 miles (47 percent below January, 2019 average)
Total March decrease: 46 percent.
The result of all this reduced driving has been clear — as in clear skies — around the nation and world (the thread is below and unrolled here):
Thread of newly clear, pollution-free skies around the world. First up, Madrid.https://t.co/trVUiqAow2
— thot crimes (@nicoleamurray) April 4, 2020


