Yet Another Flawed Congestion Report From Inrix
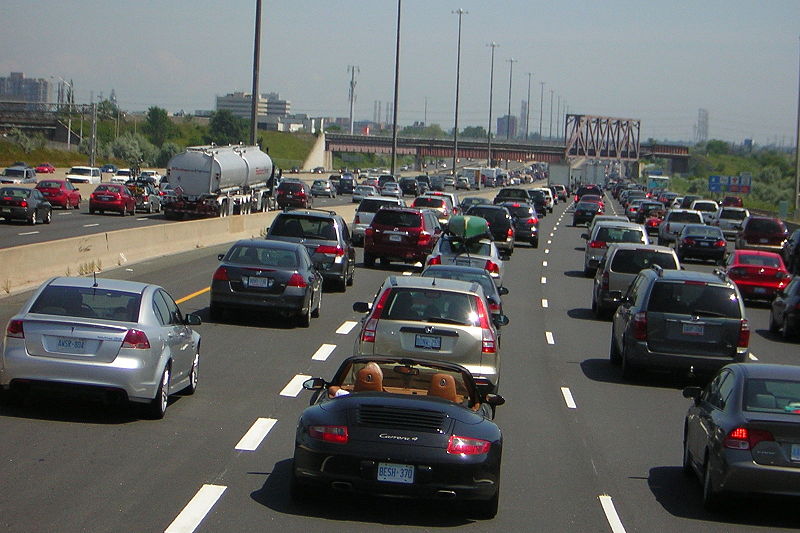
Cue the telephoto lens compressed photo of freeway traffic; it’s time for yet another report painting a picture of the horrors inflicted on modern society by traffic congestion. This latest installment comes from traffic data firm Inrix, which uses cell phone, vehicle tracking and GPS data to estimate the speed at which traffic moves in cities around the world.
Two words summarize our reaction to the new Inrix report: tantalizing and aggravating. The tantalizing part is the amazing data here: Inrix has astonishingly copious and detailed information about how fast traffic is moving, almost everywhere. The aggravating part: its essentially just being used to generate scary–and inflated–statistics about traffic that shed precious little light on what we might do to actually solve real transportation problems. Its main purpose seems to be to generate press headlines: “Los Angeles Tops Inrix Global Congestion Rankings,” “Atlanta Traffic Among Worst in the World, Study Finds,” and other scary stories.
One one level, its a truly impressive display of big data. Inrix has compiled 500 terabytes of data, for hundreds of thousands of roadway segments, from hundreds of millions of sources on more than a thousand cities around the globe. That’s a real wealth of information. Inrix casually slips in the factoid that average speeds on New York streets are 8.23 mph, versus 11.07 mph and 11.54 mph in L.A. and San Francisco respectively. But unfortunately, in this particular report, it has chosen to process, filter and present this data in a way that chiefly serves to generate heat, rather than shed any light on the nature, causes and solutions to urban traffic problems. If “big data” and “smart cities” are really going to amount to anything substantial, it has to be more than just generating high tech scare stories.
We’ve read through the report, examining its key findings and comparing it to previous work by others. We think there are four fundamental problems that readers should be aware of: the report has a new methodology, which while more detailed than previous reports, is neither comparable to them, nor a major improvement. Like other reports, the definition of congestion is unrealistic, and its cost estimates are exaggerated (with no acknowledgement that building enough capacity to reduce congestion would be even more expensive, and likely be ineffective). Most importantly, like all travel time index measures, the Inrix methodology ignores differences between average travel distances in cities, which effectively penalizes denser, more compact cities. Its disappointing to see so much data providing so little insight into what we might do to understand and solve these problems.
Methodology: New and non-comparable, but not significantly different or better
First off, Inrix has revised its methodology and definitions for computing and presenting metro level congestion statistics. They’ve segmented their data by time of day and trip characteristics, which in theory provides a more nuanced view than earlier work. But it also means that results in this year’s studies aren’t comparable at all to the data (and claims) made in earlier Inrix reports (which we’ve raised some questions about). Inrix has also changed the geographic definition of what constitutes a city or urbanized area. As a result, this report can’t tell us whether congestion is getting worse or better, or shed light on the strategies and investments that may have actually led to reductions in congestion in different cities around the world.
The failure to report data on a consistent basis over time undercuts our ability to use it to make sense of the world. For a long while, Inrix actually gathered and reported its data on a consistent monthly basis in a way that allowed independent observers to view congestion and travel time trends. This data actually showed traffic congestion easing in most metropolitan areas in the United States from 2009 2014. Inrix stopped reporting this data in 2014, and scrubbed the links to it from its website (although the original data still live on in a Tableau server you can see here).
But while the numbers are new and non-comparable, they appear to mostly be saying same thing that we were told in earlier congestion reports. So for example, we’ve graphed the 2016 Inrix Congestion Index (ICI) against the 2012 Texas Transportation Institute Travel Time Index (TTI). The two indices are calculated in different ways, and TTI runs from about 1.15 to 1.45 for each metro area while ICI runs from 1 to 19. (In both cases, the travel time index measures how much longer a trip takes due to congestion than it would during free-flow conditions; ICI omits an implied 1.0.) But the two measures are highly correlated (r-squared of .69), which says they’re really measuring the same thing in pretty much the same way, making ICI in many ways simply a gussied up, really-big-data version of the Texas Urban Mobility Report’s Travel Time Index, with all its attendant flaws.

An unrealistic definition of congestion
Second, the definition of congestion is a novel and expansive one: Any time travel speeds fall below 65 percent of free-flow speeds, Inrix regards this as being “congested.” Inrix says it determines free-flow speeds using actual traffic data. As we and other have noted, this approach often results in using speeds that exceed the posted legal speed limit for a roadway as the baseline for determining whether a road is congested. For example, if “free flow” speeds on a posted 55 mile per hour road are 60 or 65 miles per hour, Inrix would presumably use this higher baseline for computing congestion. This has the curious implication that the inability of a motorist to engage in an illegal behavior constitutes a “cost.” Also: its worth noting that roadways achieve their maximum throughput (number of vehicles moved per hour on a roadway segment) and speeds that are usually much lower than free flow speeds. (At higher speeds, drivers increase their following distance and the road carries fewer cars per hour). So in many cases, these lower speeds (say 40 miles per hour on a 55 mile per hour roadway, where free-flow speeds are 60 miles per hour), may actually be more efficient. As we pointed out in our essay “The Cappuccino Congestion Index,” no one expects businesses to have has much capacity to provide the same service at peak hours that they do in slack times.
Exaggerating costs
Third, while Inrix claims to have estimated the “cost” of congestion to travelers, these estimates are suspect for a number of reasons. Inrix uses a value higher than most other studies–almost $20 per hour for commuter travel time (a $12.81 wage rate, multiplied by 1.13 occupants per vehicle multiplied by 1.37 to reflect the aggravation of congestion). But real world experience shows that commuters actually value travel time savings at something more like $3 per hour. It also appears that there’s been a major shift in the monetization of congestion costs: Older studies like TTI, estimated dollar costs based on the additional time spent on a trip due to congestion: So if a trip that took ten minutes in un-congested traffic took a total of 15 minutes in a congested time period, they would monetize the value of the five minutes of additional time spent. The Inrix report appears to monetize the total value of time spent in congested conditions, i.e. anytime travel speeds fell below 65 percent of free flow speeds. It’s actually hard to tell exactly what they’ve done, because their explanation is at best somewhat cryptic:
The direct costs are borne directly by the car driver through their use of the roads in congestion, and include the value or opportunity cost of the time they spent needlessly in congestion, plus the additional fuel cost and the social cost of emissions released by the vehicle. (Page 8)
In our example, if congestion were evenly distributed over this same 15 minute journey, it appears than Inrix would monetize the entire 15 minutes as “time spent in congestion.” This has the effect of greatly increasing the estimated “cost” of congestion.
As we’ve pointed out before, despite the impressive sounding estimates of the value of time lost to congestion, the key question that the Inrix report begs is whether the the cost of building enough roadway capacity to eliminate congestion would somehow be less expensive than the supposed value of lost time due to congestion. Its likely the cost of building enough capacity to eliminate congestion would dwarf travel time savings–and that’s before considering the induced traffic that added capacity would add. We know from thorough academic studies like Duranton and Turner’s fundamental law of road congestion, and practical experience with freeway widening projects in Los Angeles and Houston, that spending billions of dollars on more capacity doesn’t reduce congestion, it increases traffic.
Ignoring distance, discounting accessibility
Fourth, the Inrix Congestion Index, like the TTI travel time index still has the major flaw of overlooking the differences in average travel distances between cities. Some cities have much shorter commutes than others (usually because of much more compact development patterns), and while a larger percentage of trips may occur during “congested” time periods, the total duration of trips is far shorter in these more compact metro areas. Consider two cities, one with a five mile average commute and the second with a ten mile average commute. Suppose that in both cities, drivers drove an average of two miles in “congested” conditions: Inrix would tell us that in the first city 40 percent of commuter travel was “congested” while in the second only 20 percent (2 of 10 miles) was congested. Even though both sets of commuters experienced the same amount of congestion, the more compact city had trips that were half as long. As we’ve shown this percentage-based congestion index is profoundly biased against compact cities with short average travel distances. Its frequently the cases that the average commuter in a city with a high congestion score will have a shorter duration commute time than someone living in a city with a low congestion score because they don’t have to travel as far.
Why can’t big data tell us something useful?
Think of Inrix as a test case for big data and smart cities. It has to do something more than simply serve as a high powered tool for p.r. and pro-road talking points. It should be an analytical tool which helps us figure out what works, and what doesn’t, what to do more of and what to stop doing altogether.
For example, this kind of data , should help us judge which cities are doing well, and why, and how we can learn from their successes. According to Inrix, Birmingham and Oklahoma City have some of the lowest levels of traffic congestion (at least as measured by their flawed ICI) of any of the 50 or so largest metro areas. Is there actually something that these cities are doing, or some keen insight other cities can learn that will show how to reduce traffic congestion? Absent a framework for connecting this data to policy–and for correcting the biases against compact, accessible development that are implicit in the travel time index/ICI–this data isn’t terribly useful for setting transportation policy or deciding on how best to invest in transportation infrastructure.
As we’ve argued at City Observatory, you can’t address transportation policy without a clear model of why we have congestion in the first place. There’s overwhelming evidence that roads get congested at peak hours because we’ve set too low a price for road use. When we actually charge even a modest price for road use, congestion problems evaporate (see our story about Louisville). The report’s authors, economists Graham Cookson and Bob Pishue, clearly understand that there’s something more to the traffic problem than the scary stories and big numbers presented in this report. In blogs at Inrix, both highlighted the importance of demand side strategies, specifically including road pricing. Graham Cookson wrote that we need to be “encouraging the efficient use of our roads through wider adoption of road user pricing.” Pishue acknowledges that pricing roads would reduce congestion, but apparently frets that this requires a change in behavior: “Demand-side strategies like road user pricing and flexible work schedules can be effective, yet rely on changing driver and economic behavior.” Unfortunately there’s no reference to these policies in the Inrix report itself; the word “pricing” simply doesn’t appear anywhere in its 44 pages.
Last year, we gave Inrix a grade of D for the last iteration of this report. This year we’re dropping that down to an incomplete. Inrix clearly has a wealth of data that could tell us a lot about how well our transportation systems perform, but so far, it appears that they’re chiefly interested in generating headlines, rather than providing the kind of analytical tools that could help inform policy choices. We hope they’ll do better in the future.
Cross-posted from City Observatory.

Streetsblog has migrated to a new comment system. New commenters can register directly in the comments section of any article. Returning commenters: your previous comments and display name have been preserved, but you'll need to reclaim your account by clicking "Forgot your password?" on the sign-in form, entering your email, and following the verification link to set a new password — this is required because passwords could not be carried over during the migration. For questions, contact tips@streetsblog.org.

