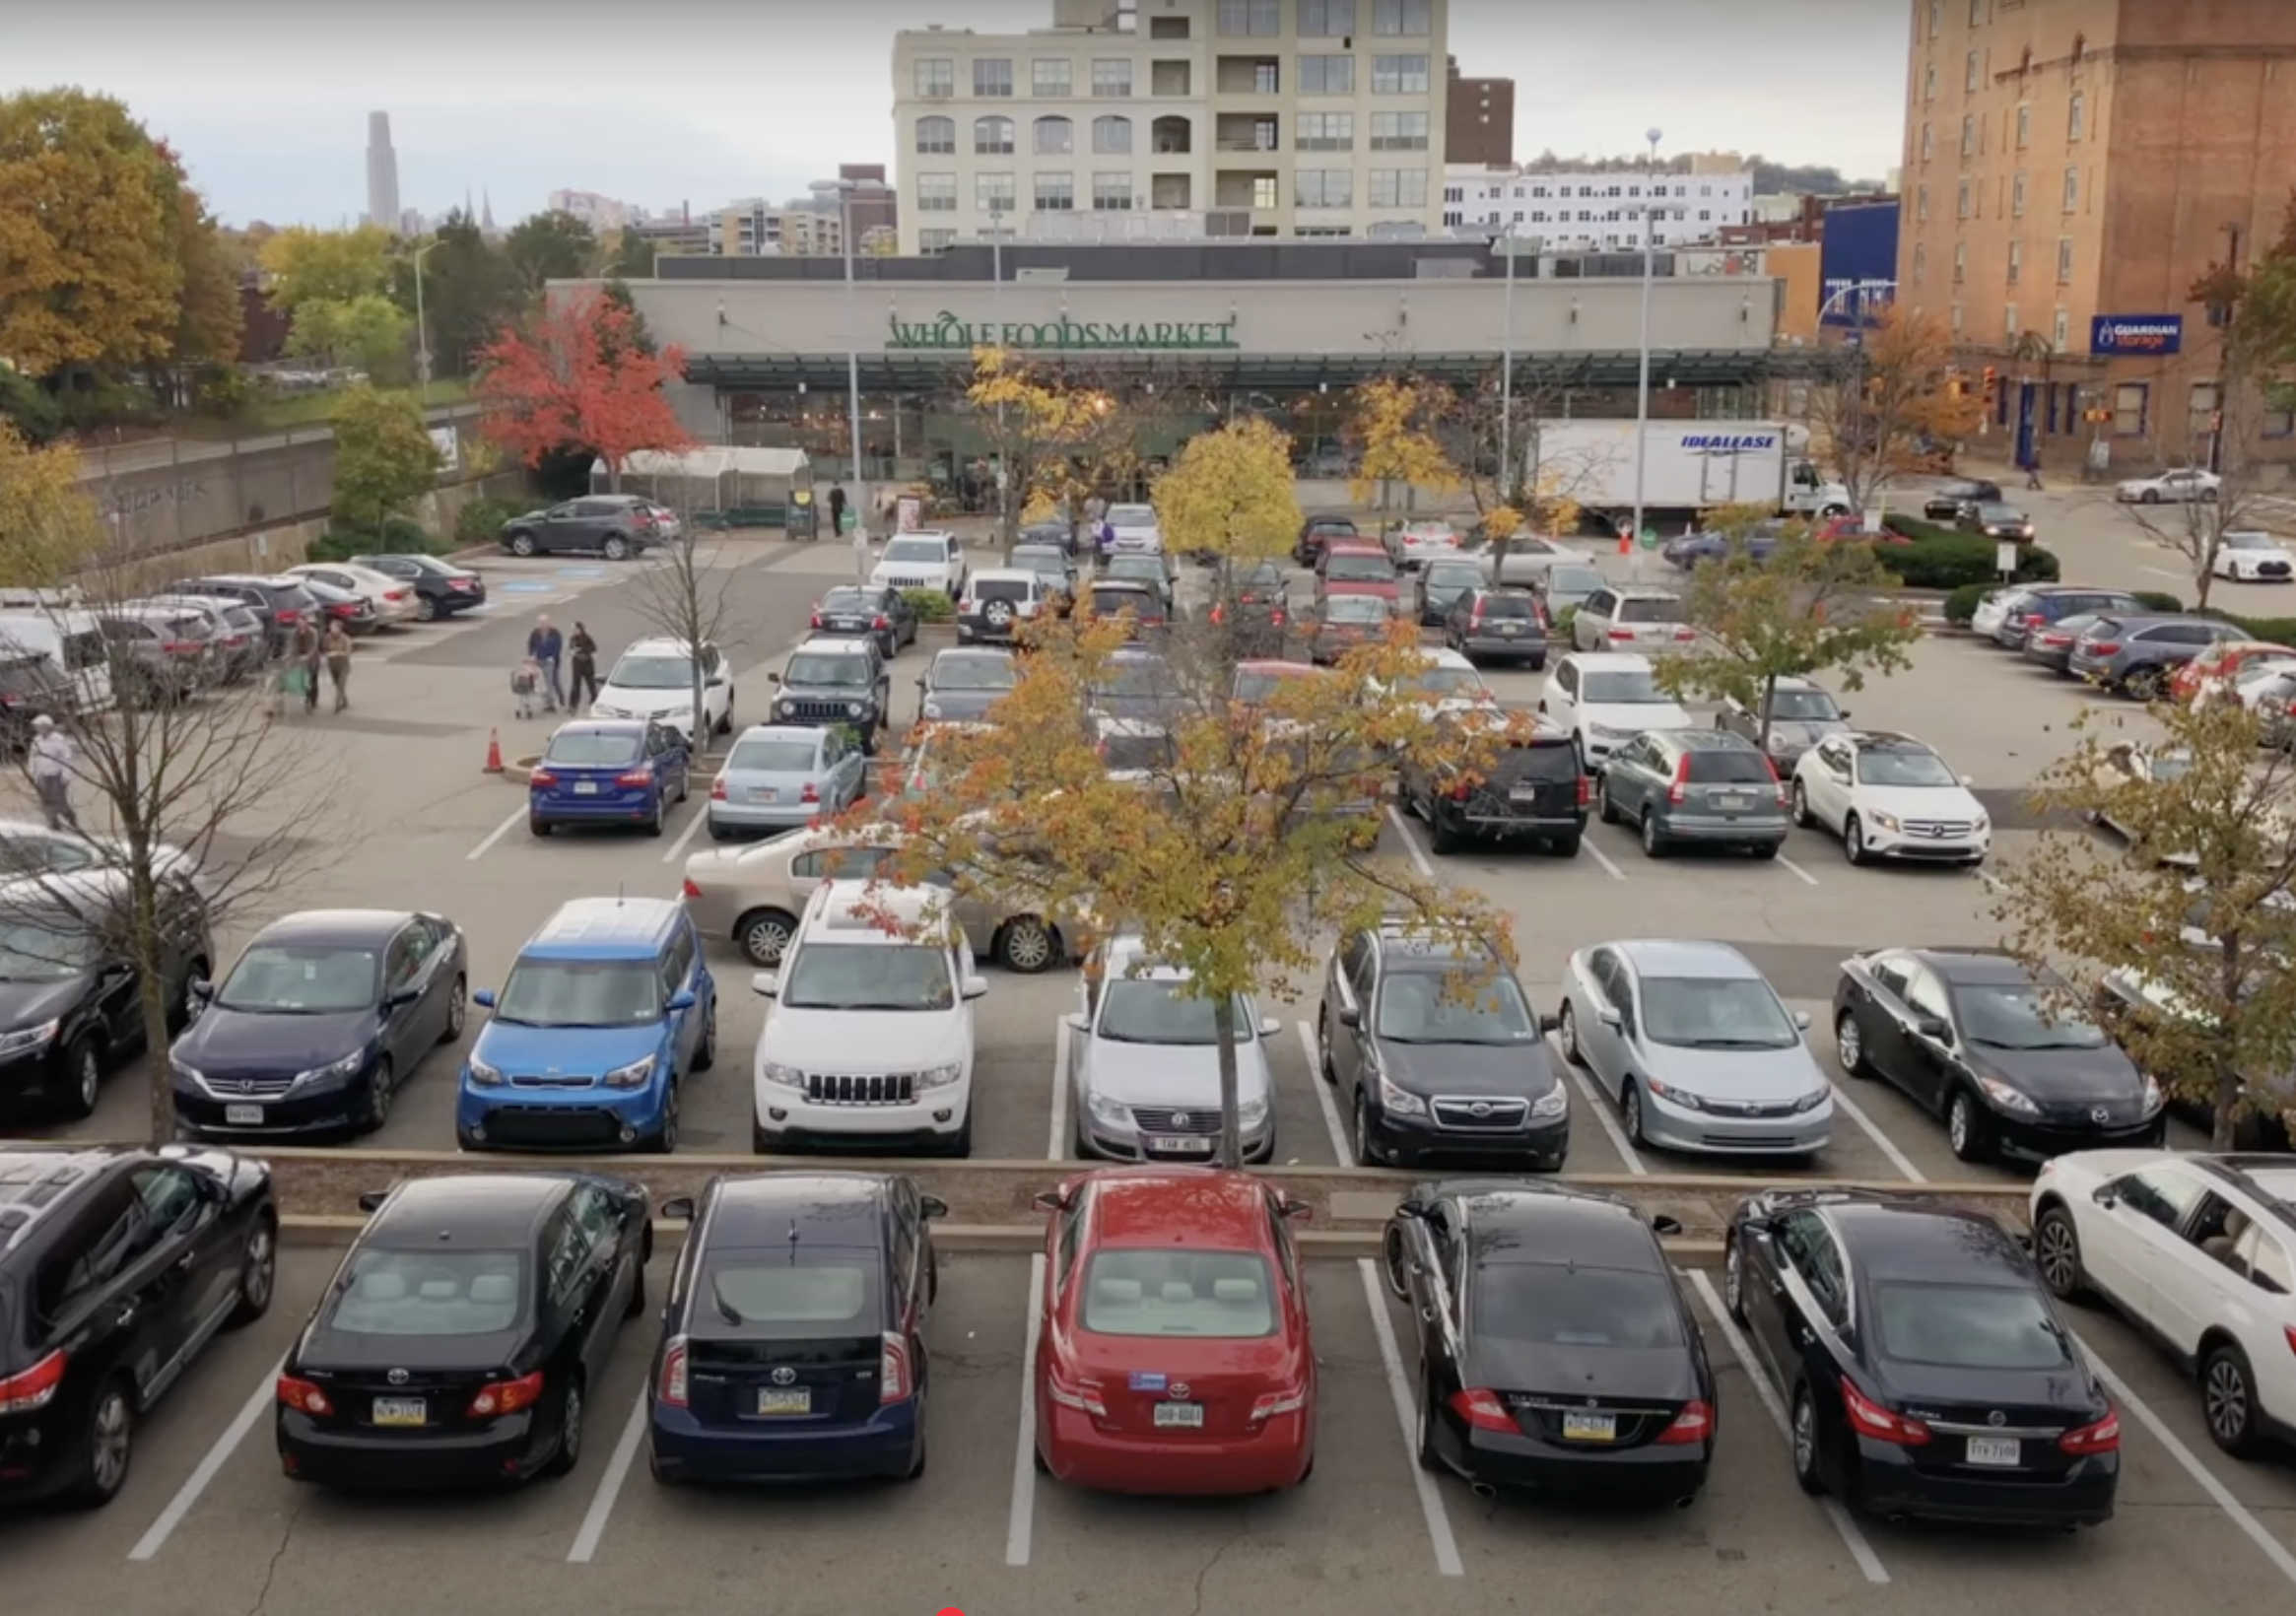
Cars are a very inefficient transportation technology for too many reasons to count. They take up huge amounts of space but get driven around mostly empty -- the average private car in the U.S. carries only 1.6 people. A lot of the time, people drive distances that are short enough to easily walk or bike -- 28 percent of car trips are a mile or less, according to the Governors Highway Safety Association.

But perhaps the most profound inefficiency is that cars mostly just sit there. Early on in Donald Shoup's influential tome, The High Cost of Free Parking, he points out that cars are parked 95 percent of the time.
Paul Barter at Network blog Reinventing Parking wanted to show the basis for this assertion. Turns out, it's a surprisingly bullet-proof figure that holds up across different methods of calculation and in different countries. He crunched the numbers three ways:
Option #1: based on the number of cars, the number of car trips and the average time duration of car trips:
A UK report on parking put out last year by the RAC Foundation (and well worth a read by the way!) uses this method based on data from the UK National Travel Survey (NTS) (see p.23):
"... there are about 25 billion car trips per year, and with some 27 million cars, this suggests an average of just under 18 trips per car every week. Since the duration of the average car trip is about 20 minutes, the typical car is only on the move for 6 hours in the week: for the remaining 162 hours it is stationary – parked."
Since there are 168 hours in a week, the typical UK car is parked 96.5% of the time - even higher than Shoup's US estimate!
With this method, be careful to use car trips and not just trips by car. In other words, you want trips by car as driver so that you don't count trips as a car passenger. If you only have a total for both drivers and passengers then you will need to find an estimate of overall average car occupancy and divide by that to get the vehicle trips (driver trips) number.
Option #2: Based on time drivers spend driving (from transportation surveys) and assuming one car per driver.
If your local travel survey spits out a number for time spent driving then you can use that directly for a rough estimate.
This is how Shoup gets his 95% number. See Appendix B (p.624) of his epic tome "The High Cost of Free Parking". He cites the 1995 Nationwide Personal Transportaton Survey (NPTS) of the US Department of Transportation as finding that the average time drivers spent driving was 73 minutes (1.2 hours). Assuming one car per driver (which is roughly OK probably for the US context), this gives 5% as the time each car is in motion.
Option #3: Using car kilometres per car and overall average speeds
Transportation studies for metropolitan areas often provide data on the average yearly distance driven per car and the overall (24 hour, 7 days) traffic speed. If so, you can use this easy method (although note that those 24/7 speed numbers may not be the most solid of transport statistics I suspect). If you don't have car km per car you may be able to get it by dividing total car km by the number of cars, being careful that the two numbers are for the same study area.
The average time each car is in motion is the car km per year divided by the average speed.
I took a look at the 1995 UITP Millennium Cities Database numbers using this method. The average percentage of time that cars were parked for the 84 cities in that study was 95.8%. They were typically in motion for 1.02 hours per day.
Barter says the data underscores the massive savings that could be realized if cars were used more efficiently via car-sharing or on-demand services like taxis or Uber.
Elsewhere on the Network today: The Dallas Morning News' Transportation reports that a survey of who uses toll lanes doesn't quite fit the "Lexus Lanes" stereotype. The Washington Post has again published an editorial in which the writer fantasizes about killing cyclists, notes the FABB Blog. And Bike Portland has a map of where the city's new Biketown bike-share stations will go.


