Which Cities Are Adding Walkable Housing the Fastest?
As more Americans look for walkable places to live, cities are struggling to deliver, and a lot of neighborhoods are becoming less affordable. A new analysis by Kasey Klimes of Copenhagen’s Gehl Studio illustrates how major metro areas have let their supply of walkable housing shrink over the years, contributing to today’s housing crunch.
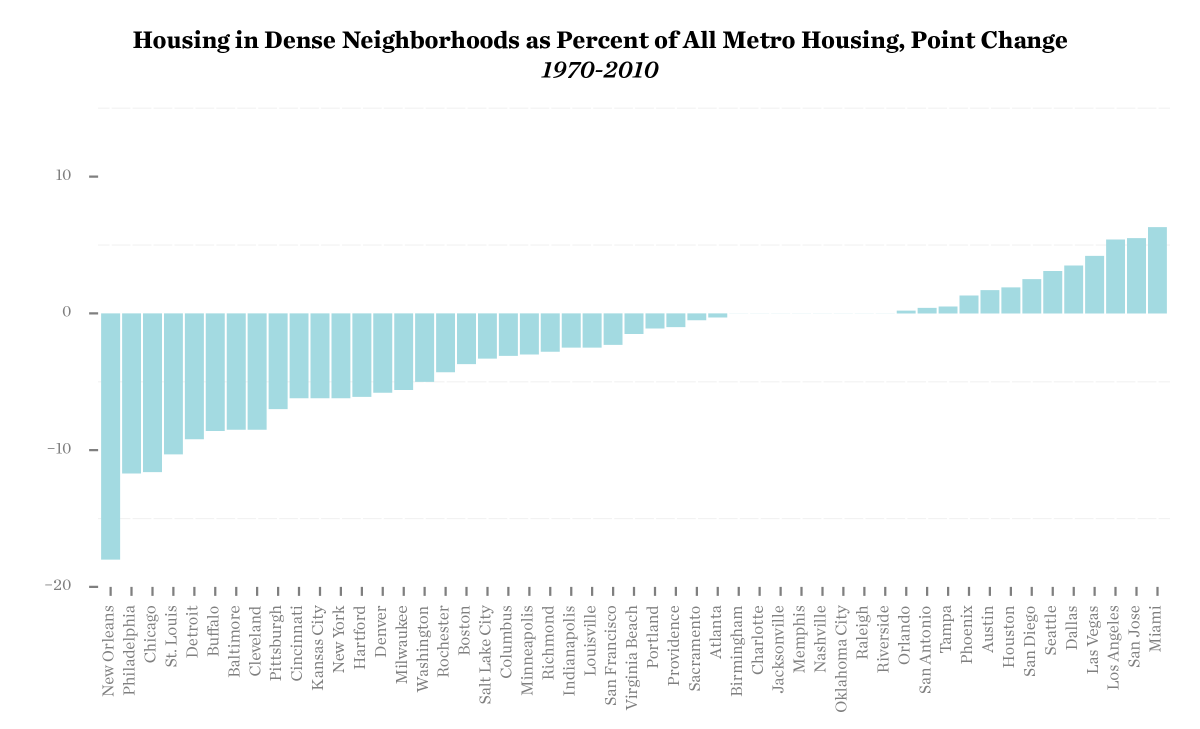
In this chart, Klimes shows how much walkable neighborhoods, which he defines as places with 10 or more housing units per acre, have grown or declined as a share of total housing in the nation’s 51 largest regions, from 1970 through 2010.
In most places, Klimes writes, the trend since 1970 has left cities in bad shape to handle the increasing demand for walkable neighborhoods:
The percentage of housing in walkable neighborhoods has dropped from 19.4% to 12% since 1970. Overall, though the number of housing units in America has outpaced population at a ratio of 3:2 since 1970, the number of housing units in walkable neighborhoods has trailed behind population growth at a ratio of 3:1. Now that market preference has returned to dense housing, this mismatch has left us far behind in adequate supply.
The silver lining is an uptick in decade to decade construction of dense housing. The net gain of housing in walkable neighborhoods as a fraction of total net housing gain by decade has increased from just 0.3% in the 1970’s to 10.7% in the 2000’s.
Despite some recent progress, the mismatch between low supply and high demand is contributing to rising housing prices and burdening people with rents they can’t afford in many cities and neighborhoods. Zoning that outlaws walkable development and the disproportionate political power of development-averse property owners are two factors that have hindered housing development where it is most in demand.
Meanwhile, take a look at overall growth in attached housing units (apartments, condos, and the like) by metro area:
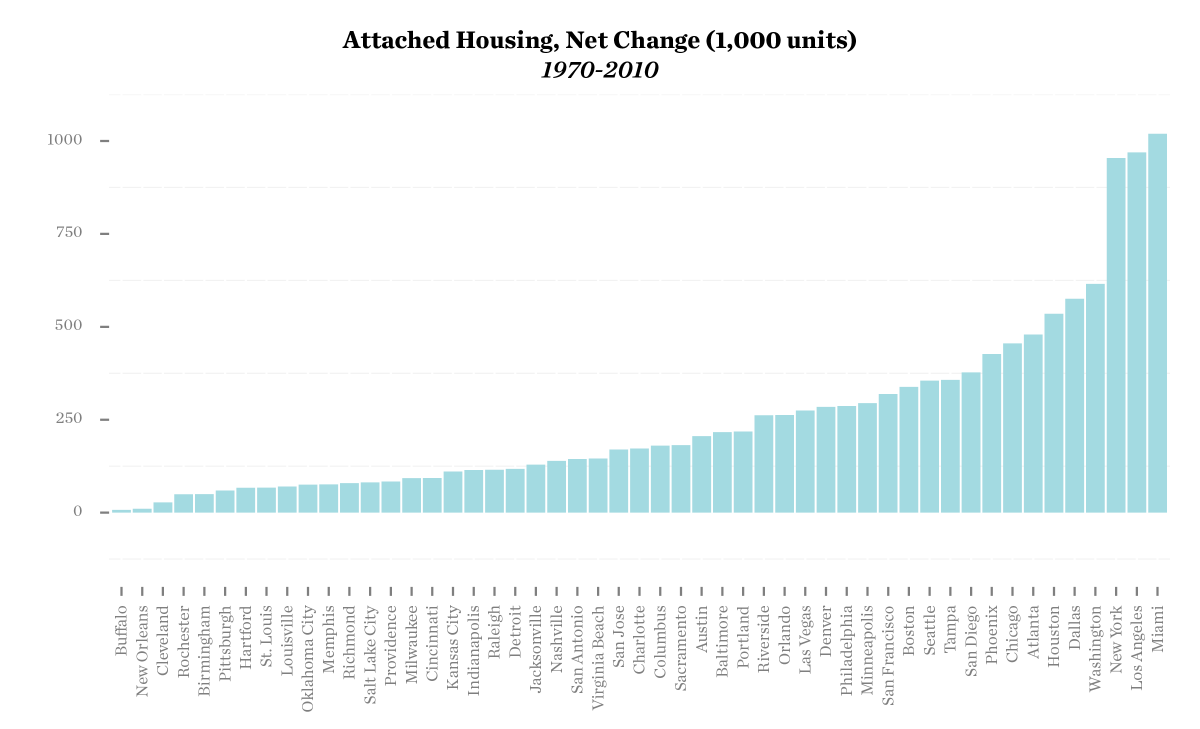
Klimes says this graph tells two stories — one about zoning and development restrictions and one about population and economic growth:
Virtually all major metros increased their absolute supply of attached housing between 1970 and 2010 (Figure 1). The largest absolute increases tended to be in larger housing markets in which housing is already dense, but when broken down by the point change in percentage of total housing (Figure 2) [at the top of this post], a very different set of cities rises to the top. The most dramatic shifts occurred in growing low-regulation markets in pleasant climates such as Miami, Orlando, and San Diego. Trailing just slightly behind are west coast cities like Portland, Seattle, San Jose and Los Angeles. At the bottom of the list are cities that have weathered difficult economic trajectories, like New Orleans, Philadelphia, and Buffalo.
Hat tip: Yonah Freemark

Read More:
Streetsblog has migrated to a new comment system. New commenters can register directly in the comments section of any article. Returning commenters: your previous comments and display name have been preserved, but you'll need to reclaim your account by clicking "Forgot your password?" on the sign-in form, entering your email, and following the verification link to set a new password — this is required because passwords could not be carried over during the migration. For questions, contact tips@streetsblog.org.