Every Traffic Fatality in the U.S. — Mapped
What is the most dangerous street in your region? Which one most needs improvements to protect cyclists? Where do drunk drivers do the most damage? Thanks to a new tool from New York City data scientist Max Galka, you can get a pretty good sense with a few clicks.
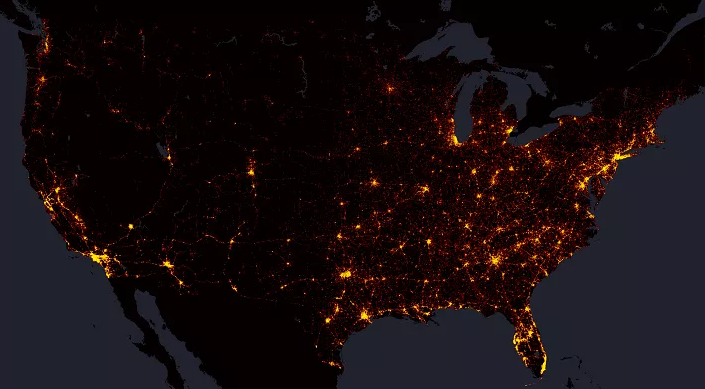
Galka recently completed a map of every traffic fatality in the U.S. between 2004 and 2013, using data from the National Highway Traffic Safety Administration's Fatality Analysis Reporting System (FARS).
Zoomed out, it looks like a map of population density and highways in the U.S. The real insights come when you zoom in to a local level.
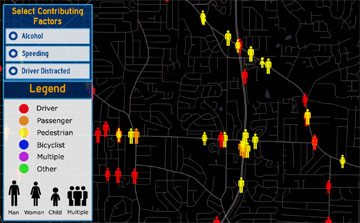
The map is coded to convey information about victims and contributing factors like speeding or drunk driving.
While a handful of cities make more detailed traffic crash information available publicly online, in most places, Galka's map can provide fresh insight into the scale of traffic violence on our streets. You can locate your own neighborhood by entering your address in the search bar.
Galka told Streetsblog he tried to stay away from interjecting his views too strongly into his analysis, but his work on the map revealed a couple of things.
"What struck me most was the number of accidents that were likely preventable," he said. "Fifty-eight percent were caused by either alcohol, speeding, or driver distractions. In particular, speeding appears to be far more dangerous than I realized."
Stay in touch
Sign up for our free newsletter
More from Streetsblog USA
Four Things to Know About the Historic Automatic Emergency Braking Rule
The new automatic emergency braking rule is an important step forward for road safety — but don't expect it to save many lives on its own.

Who’s to Blame for Tuesday’s Headlines?
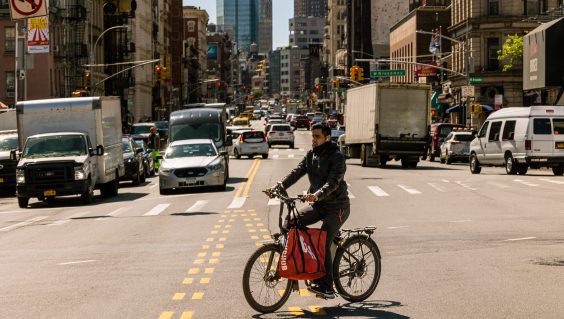
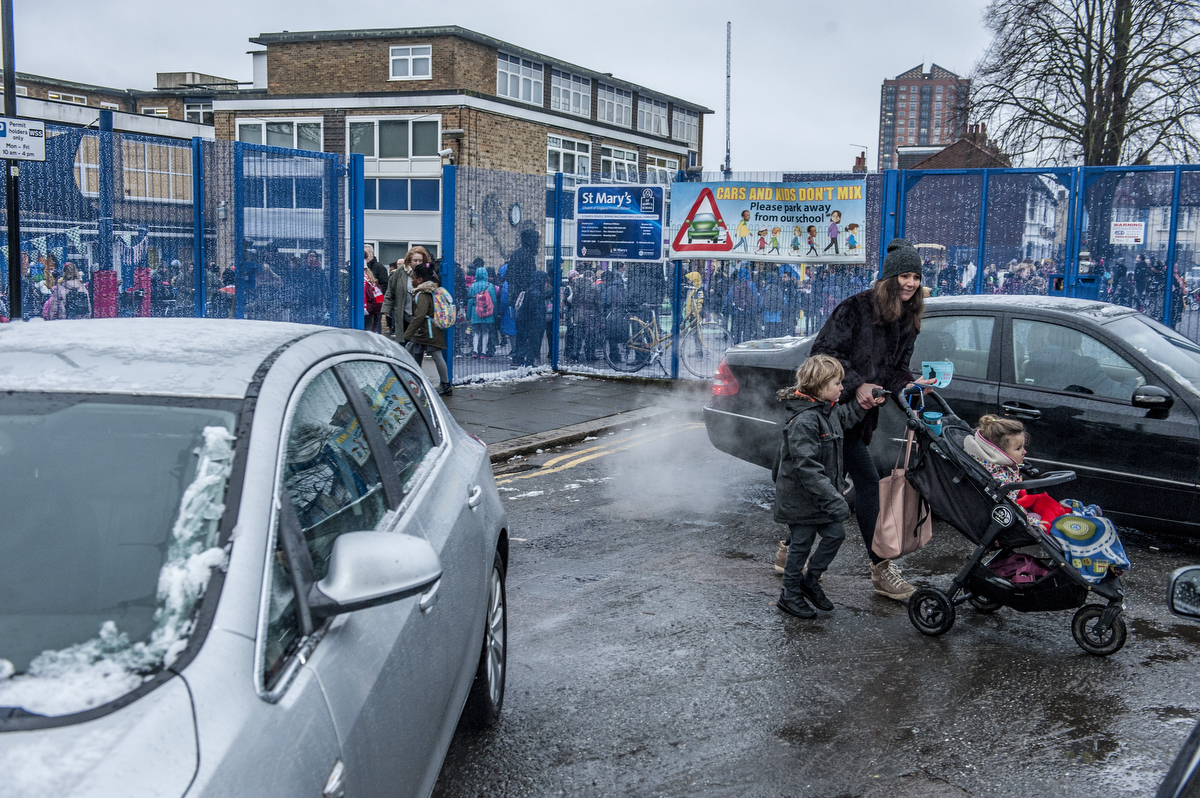
Are the people in this photo inherently "vulnerable", or is this car just dangerous?
Why Riders With Disabilities Have To Sue For Accessible Transit Stops
A Bay Area transit agency is only the latest to be sued over inaccessible stations. What will it take to get every American stop ADA compliant?
Monday’s Headlines Reconnect With Pete
More than $3 billion is flowing out of the White House to help correct infrastructure mistakes in Black communities.

‘Buy, Bully, Bamboozle’: Report Shows App Companies Threaten Democracy
App delivery companies seek to block worker-led improvements by spending big money on political influence, leveraging their data, and even co-opting progressive language, argues a new report that lands days before a national one-day strike by app-workers.