At the risk of repeating ourselves: The Texas A&M Transportation Institute (TTI) got it wrong again.
Their 2012 Urban Mobility Report (using 2011 data) just came out [PDF]. Like every year, they tout their “improved methodology,” but the authors still haven't made the changes that would make their congestion rankings meaningful in the real world.
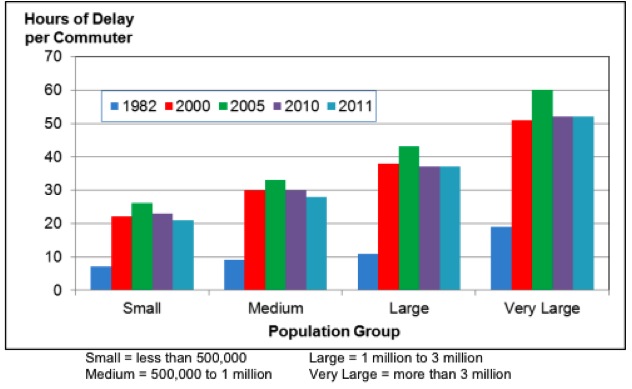
Not only that, they continually sound the alarm about how much worse congestion has gotten in the last 30 years, but they fail to note (except in the chart above) that we must be doing something right these past six years because congestion is down significantly from 2005. It probably has something to do with the fact that Americans are driving less.
TTI's Travel Time Index measures congestion based on how much longer it takes to drive a road in congested conditions than free-flowing conditions. They’ve now upgraded to a Planning Time Index, which appears even less useful. The PTI is a measure of the extra time a traveler would need to allow for to arrive on time for “higher priority events, such as an airline departure, just-in-time shipments, medical appointments or especially important social commitments.”
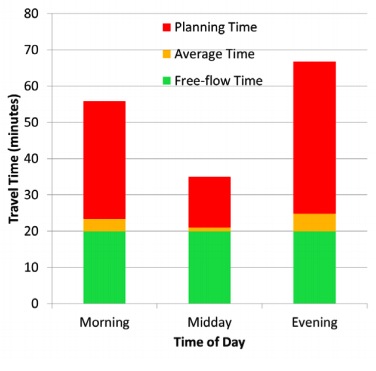
If the PTI for a particular trip is 3.00, a traveler would allow 60 minutes for a trip that typically takes 20 minutes when few cars are on the road. Allowing for a PTI of 3.00 would ensure on-time arrival 19 out of 20 times.
PTIs on freeways vary widely across the nation, from 1.31 (about nine extra minutes for a trip that takes 30 minutes in light traffic) in Pensacola, Florida, to 5.72 (almost three hours for that same half-hour trip) in Washington, D.C.
That number earned DC the nation's worst congestion ranking this year.
I don’t know how realistic this PTI is -- who really allows for nearly three hours to make a half-hour trip? But more important: If you had to budget three hours for a trip that would only take half an hour driving in good conditions, wouldn’t you start to look for other transportation options? However far that “half-hour” trip is (they don’t give mileage) you could probably bike it in less than three hours.
One useful change the report authors made this year was the inclusion of carbon emissions attributed to traffic congestion. They calculate congestion’s toll on the ozone layer at 56 billion pounds – about 380 pounds of carbon per car commuter. A total of 2.9 billion gallons of fuel is burned in these traffic jams.
Of course, that’s not the whole story. If they’re trying to get at unnecessary emissions and fuel use, they should include all the automobile trips that are made alone that could have taken on passengers; all the trips made by car that could have been done by transit, foot or bike; and all the trips made longer by the fact that poor street design and land use decisions have spread residences, amenities, and services so far apart that every trip requires a car. If they want to figure out the carbon emissions that are cooking our planet without reason, TTI would be well served to start with those.
And that’s the problem with TTI’s rankings, and it’s what we say every year: To rank cities’ congestion based on nothing but freeway speed misses the point and risks incentivizing terrible transportation decisions. The Washington, DC region has excellent transit options, so its citizens don’t have to sit in three hours of traffic. We have miles of useful bike lanes, on- and off-road, inside and outside the city limits. We even pioneered the use of slug lines, which allow car-free commuters to catch rides with strangers who want to use carpool lanes.
How long will it take you to reach your destination using those travel options? What if you move to a first-ring suburb or, god forbid, the city? TTI doesn’t say. It doesn’t rank cities based on the multiplicity of alternatives to sitting in mind-numbing, air-smogging traffic.
TTI does do lip service to the need for transportation options, recommending a “balanced and diversified approach to reduce congestion – one that focuses on more of everything.”
“Some areas might be more amenable to construction solutions, other areas might use more travel options, productivity improvements, diversified land use patterns or redevelopment solutions,” they write.
And buried inside the report, with no mention in the press release, is their annual report on the benefits of public transportation – for drivers, that is. If your metro or bus commute saves you time, makes you happy, gives you time to read or sleep, and gets you to work on time – well, bully for you but that doesn’t figure in to TTI’s index. All they care about is how much it helps motorists for you to have your behind on a subway seat instead of the driver’s seat.
Last year, transit saved 56 billion vehicle-miles and 865 million hours of delay for drivers. That’s 450 million gallons of fuel and $20.7 billion. The great majority of that savings was in just 15 “very large” urban areas. Americans who are driving less, or not at all, sure are helping those who haven't kicked the habit.
TTI also measures the savings from “operational treatments” (though the report buries the definition in a footnote 50 pages after the first mention). The treatments include freeway incident management, freeway ramp metering, arterial street signal coordination, arterial street access management and high-occupancy vehicle lanes. These systems save drivers 374 million hours a year, and could save another 468 million hours if they existed on all roads.