The U.S. Census is the most widely cited source of data about how Americans get around. It's updated regularly and it covers the whole country, but it comes up short in a number of ways. The Census only asks about commute trips, and commuting only accounts for about 16 percent of total household travel [PDF]. What happens when you measure the other 84 percent?
Researchers at the University of Minnesota set out to design a better way to track how people move around the Twin Cities region, and one key finding is that walking and biking appear to be growing a lot faster than the Census indicates.
The UMN survey asked about 1 percent of the region's residents to keep a travel diary, recording every trip. This resembles the National Household Travel Survey, a more detailed but infrequently-conducted cousin to the Census data on commuting, but the sample collected by the UMN team was much bigger. That's especially important for measuring less prevalent modes of travel like walking and biking. The UMN study also provided more detailed information about people's origins and destinations than the National Household Travel Survey.
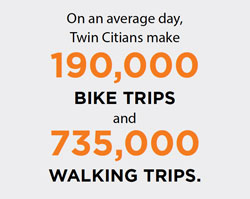
The UMN team found that driving decreased in the region between 2000 and 2010, while biking and walking grew. Cycling rose over that period from 1.4 to 2.2 percent of trips. That's about 190,000 daily trips, or a 58 percent increase. Meanwhile, walking grew from 4.5 to 6.6 percent of trips, a 44 percent increase, or almost three quarters of a million daily trips. Residents of the Twin Cities region typically make about 12 million total daily trips.
What's especially interesting is that the share of biking and walking trips in the UMN survey is much bigger than what the Census indicates -- about two to three times larger.
David Levinson, a UMN engineering professor and co-author of the research, said he expected the data to show a higher number of biking and walking trips because the Census examines such a limited subset of travel. But he didn't expect the difference to be so large.
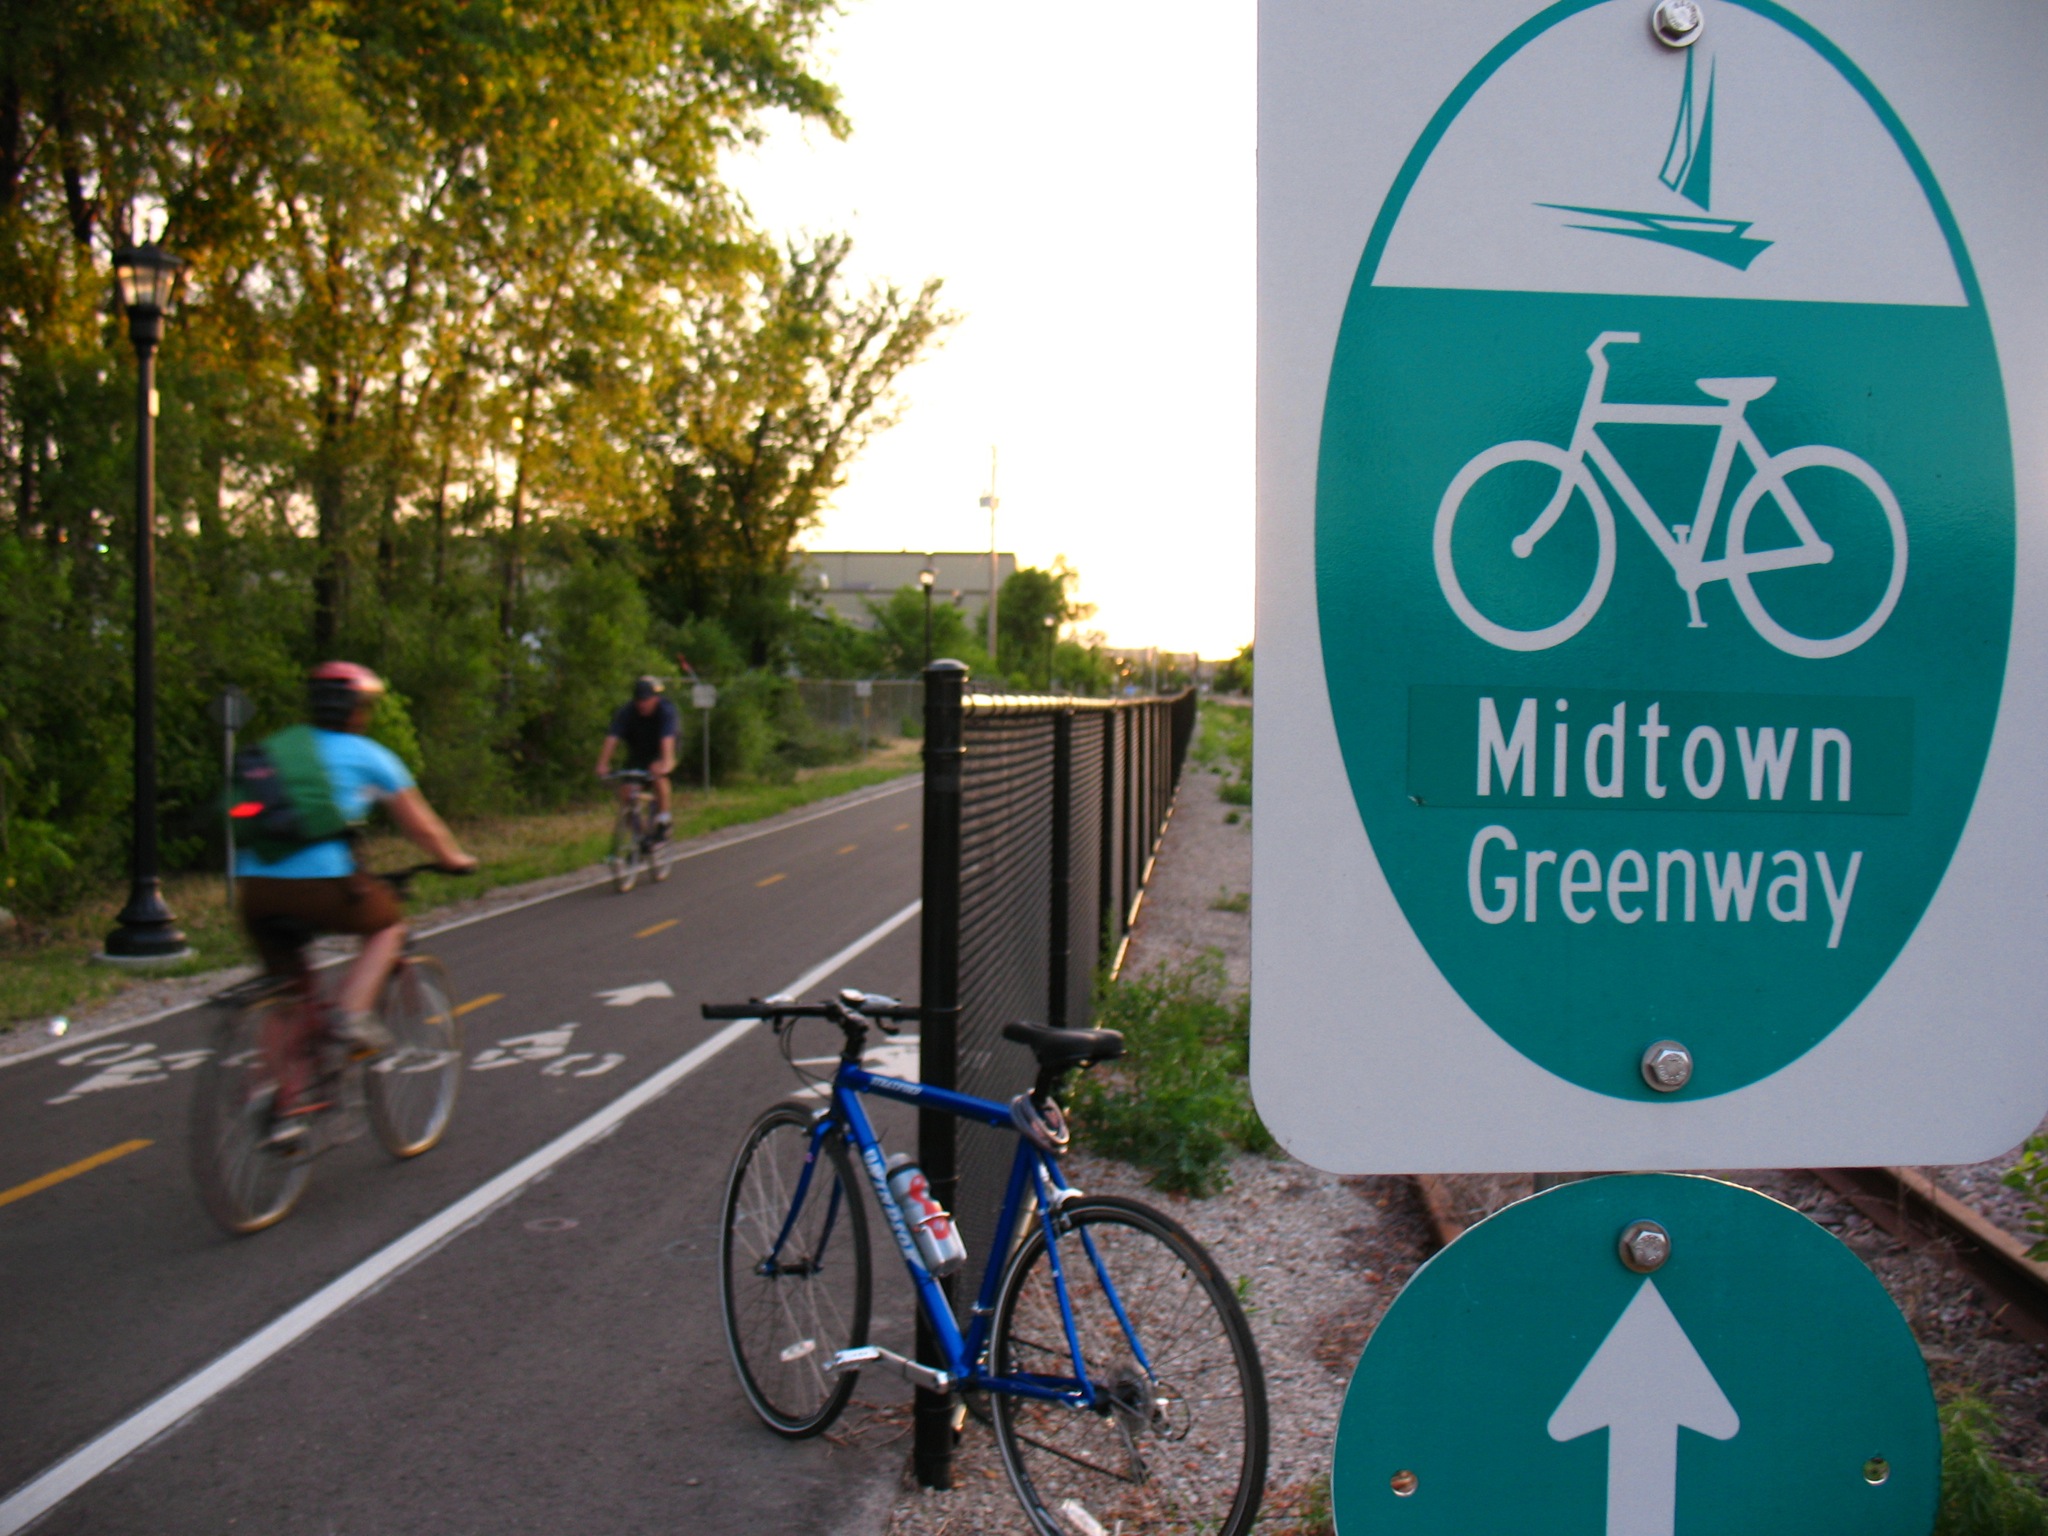
Levinson noted that the increase in cycling coincides with major local investments in biking infrastructure for the region. "If you provide facilities, you’ll get more users of those facilities -- that goes for any mode," he said.
The more detailed data Levinson and his team collected will be used by regional planners at the Metropolitan Council on forecasts to inform decisions about transportation infrastructure.