What the Equality of Opportunity Project Actually Says About Commuting
With their powerful results, the studies coming out of the Equality of Opportunity Project, led by Raj Chetty and Nathaniel Hendren, have become an important touchstone for journalists and transportation policy advisers. In their 2014 [PDF] and 2015 [PDF] studies, Chetty and Hendren show that place matters for low-income families. When low-income families have the opportunity to raise their children in better environments, their children do better as adults. And with their use of “big data,” Chetty and Hendren can show that these better environments are not just correlated with improved incomes, but actually cause them.
The Equality of Opportunity Project did not set out to be a study of transportation policy. Only one of the 40 variables that they tested speaks directly to transportation. This variable could have easily disappeared, like most of the other tested variables that did not make the final model.
Instead, transportation turned out to be extremely important. References to the Equality of Opportunity Project's findings have found their way into numerous newspaper articles, policy reports, grant applications, and prominent public discussions of transportation policy that continue to this day.
The project’s transportation variable involves commutes. I say “involves commutes” because in an unfortunate bit of nomenclature, Chetty and Hendren call this variable “commute time.” This mis-naming has led to continuing confusion among journalists and policy advisers, who make the intuitive, but inaccurate, leap to describing what happens to families when a parent spends a long time commuting.
Instead of measuring “time” in the conventional sense of “minutes,” Chetty and Hendren do something quite different. Their commute variable is defined by the percent of commuting workers who can get to their job in less than 15 minutes. It’s a measure of people, not time.
Moreover, it’s a measure of the relative size of a very select group of people: workers with really short commutes. Nationally, this group is a shrinking minority. In 2000, 29.4 percent of commuters got to work in less than 15 minutes. In 2015, this percentage had fallen to 26.2 percent.
Chetty and Hendren find that for counties and multi-county commute zones, the higher the percentage of workers with really short commutes, the better it is for the children of low-income families.
To humanize what I am rechristening the “short commutes” variable, a journalist or policy adviser could talk about the probability of a parent in a low-income family having a really short commute. The short commutes variable, however, says very little about the impact of lengthy commutes. Nor does it say much of anything about the importance of transit service: Only 3.5 percent of workers who commute by bus or rail enjoy a trip of less than 15 minutes.
Truer to what Chetty and Hendren are actually measuring would be to describe what a community looks like when a large percentage of workers have short commutes. Are they the teachers at the elementary school? The assistant pastor at the church? The nurses at the neighborhood clinic? The stylists at the salon down the street? The workers at the local factory? Chetty and Hendren can’t tell us who these people are, these lucky ones with the really short commutes. What Chetty and Hendren do say, however, is that people with really short commutes are a larger presence in counties and commute zones in which poor children grow up to be better off.
For those of us who wake up at 2:00 a.m. obsessing over urban development patterns, Chetty and Hendren’s short commutes variable presents a different conundrum. They group the short commutes variable with other variables that more directly measure income inequality and segregation by income and race. They assert that their short commutes variable measures “sprawl,” appearing to assume that places with more short commutes correspond to places that are more compact.
Moreover, Chetty and Hendren find that the short commutes variable is a much better predictor of children being better off as adults than their other measures of segregation by income and race. Short commutes becomes their go-to measure for what they start calling “segregation and sprawl.”
The problem is that neither short commutes nor commute time as conventionally understood are very good indicators of sprawl. As Reid Ewing and Shima Hamidi preface their recent re-analysis of the data used in Chetty and Hendren’s 2014 study, “commute times to work is not a valid proxy for urban sprawl.” More compact places tend to have longer average commute times and fewer short commutes.
Ewing and Hamidi’s solution is to replace the short commutes variable with their own compact index that measures urban sprawl via “development density, land use mix, population and employment centering, and street connectivity.” They find a significant (in the statistical sense) positive relationship between compact metropolitan areas and economic mobility, the subject of Chetty and Hendren’s 2014 study.
Still an open question is whether substituting Ewing and Hamidi’s compact index for short commutes will show similar positive results in a re-analysis of Chetty and Hendren’s 2015 “big data” study. The 2015 “big data” study, unlike their 2014 study on economic mobility, aimed to isolate the causal effect of each county on future earnings. The 2015 study controls for the tendency of certain economically mobile groups to gravitate to specific places.
For most counties, economic mobility and impact on future earnings are highly correlated. However, there are important exceptions. Chetty and Hendren highlight the city of New York, which ranks highly in the 2014 study of economic mobility, but has a negative impact on children’s earnings as adults.
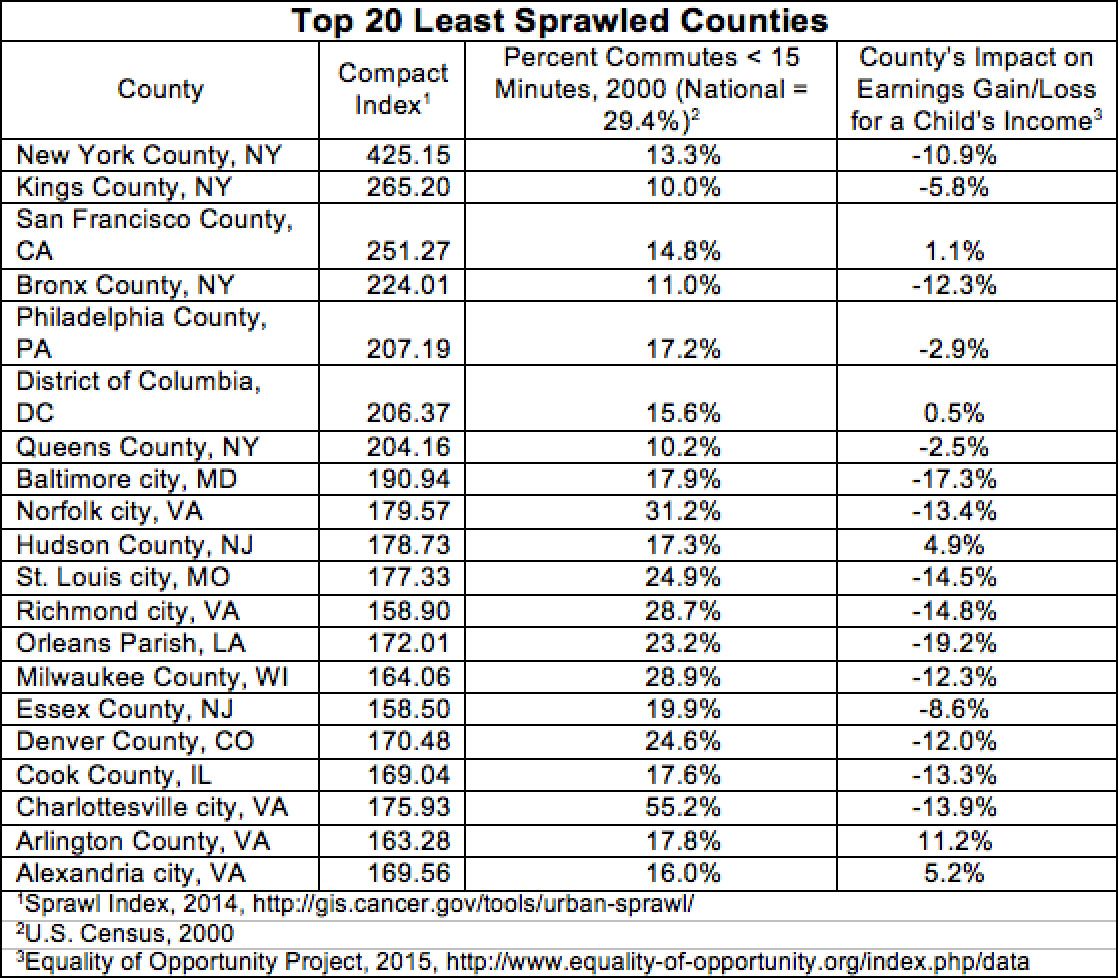
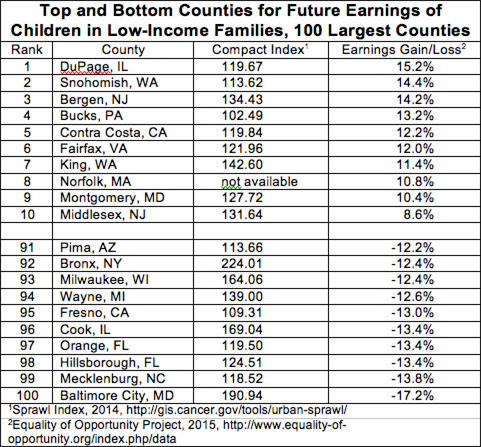
A cursory examination of Ewing and Hamidi’s top 20 compact counties does not look promising for low-income children. Only five of the top 20 compact counties provide even modest earnings gain for children raised in low-income families. Flipping the relationship, Chetty and Hendren’s top 10 and bottom 10 performing counties (out of the 100 largest counties in terms of population) have compact scores ranging from 102.49-142.6 and 113.66-224.01 respectively.
Ewing and Hamidi’s substitution raises another policy question: is simply ignoring Chetty and Hendren’s short commutes variable the best response? Yes, we who study urban development patterns and transportation policy never would have used it, but does this make their short commutes variable a mistake or a gift?
What does it mean that short commutes outperforms more direct techniques to measure income and racial segregation in predicting which places are better for the children of low-income families? What is short commutes even measuring?
Taken literally, the short commutes variable would mean focusing on policy responses that increase the number of workers with commutes less than 15 minutes. Policies that simply speed up commutes would not be enough. Alternatively, the importance of short commutes could lead to policy responses that enabled more people to live and work in the same local communities. The short commutes variable could even imply a policy response that would seek to disperse jobs in multiple centers throughout a metropolitan area and to encourage commuting by car.
Chetty and Hendren, however, in my communications with the Equality of Opportunity Project, remind policy advisers and journalists that correlation is not causation. Although the 2015 study shows the causative effect that counties have on earnings, the variables in their model are still correlates. The causal mechanism that short commutes represents still needs additional research.
Nor should we lose sight of Chetty and Hendren’s larger point: every metropolitan area has counties that are better and worse for raising children in low-income families. Most of the counties that are better are suburban, but some suburban counties are worse.
Sarah Jo Peterson, PhD is the founding principal of 23 Urban Strategies, LLC, which works at the intersection of transportation, land use, and sustainability.
Stay in touch
Sign up for our free newsletter
More from Streetsblog USA
‘We Don’t Need These Highways’: Author Megan Kimble on Texas’ Ongoing Freeway Fights
...and what they have to teach other communities across America.
Should Wednesday’s Headlines 86 SUVs?
American tax law encourages people to buy the gas-guzzling and deadly vehicles, but some in Canada are pushing to ban them.

Brightline West Breaks Ground on Vegas to SoCal High-Speed Rail
Brightline West will be a 218-mile 186-mile-per-hour rail line from Vegas to Rancho Cucamonga — about 40 miles east of downtown L.A. — expected to open in 2028.

Tuesday’s Headlines Fix It First
How voters incentivize politicians to ignore infrastructure upkeep. Plus, are hydrogen trains the future of rail or a shiny distraction?

Why We Can’t End Violence on Transit With More Police
Are more cops the answer to violence against transit workers, or is it only driving societal tensions that make attacks more frequent?