The Data Changes, But the State DOT’s Traffic Projections Stay the Same

The above graphic comes to us today from Network blog Strong Towns by way of the Sightline Institute. It shows the Washington Department of Transportation's traffic projections for State Route 520, across Lake Washington.
You might say the state's traffic projections are completely out of touch with reality. The graphic comes from a 2011 post from Sightline's Clark Williams-Derry, who does a masterful job explaining how state DOTs justify billions of dollars in public spending on bad projects:
An essay by philosopher Harry Frankfurt, first published in the mid-1980s but re-released in book form in 2005, offered what was perhaps the first serious analysis of a topic near and dear to any political observer’s heart: bullshit. Frankfurt argues that bullshit differs from lies in one important way. The liar believes that there IS such a thing as the truth: it’s the thing that the lie is designed to conceal. In contrast, a bullshitter has no regard for the very idea of truth. To a true bullshit artist, words are little more than a tool to achieve some arbitrary purpose -- to seem informed, for example, or to manipulate other people so that they’ll do what you want them to. Whether words are true or false is beside the point; all that matters to the bullshitter is the effect that his or her words achieve.
Here's an example of a misleading point made by WSDOT: “Traffic generally rose annually since 1984, until… the middle of the 2000s." It was easy for Williams-Derry to refute:
Ungrammatical, but still B.S. WSDOT’s Annual Traffic Report found year-over-year traffic declines in 1993, 1996, 2000, 2001, 2002, 2004, 2005, 2006, 2007, and 2008. WSDOT’s Ramp and Roadway Report is only released every other year, but found biennial declines in 1990, 1992, 2000, 2002, and 2008. Similarly, the Seattle DOT reports data only for 1996 through 2004, but found year-over-year traffic declines in 1997, 1999, 2000, 2002, and 2004. In short, traffic generally rose annually until the middle of the 1990s, after which came a mixture of slight increases and slight decreases, depending on which year and which data source you look at.
State DOTs are still using models that are hard wired with these made-up projections. Without smart watchdog groups like Sightline, it's hard to know whether a state DOT's numbers are worth the paper they're written on.
Elsewhere on the Network today: BeyondDC considers the best way to lift Washington's height limit. The Naked City reports the Charlotte region is trying to rezone a car-oriented street into a transit corridor. And Stop and Move shares a particularly odious example of "leap frog" development.
Stay in touch
Sign up for our free newsletter
More from Streetsblog USA
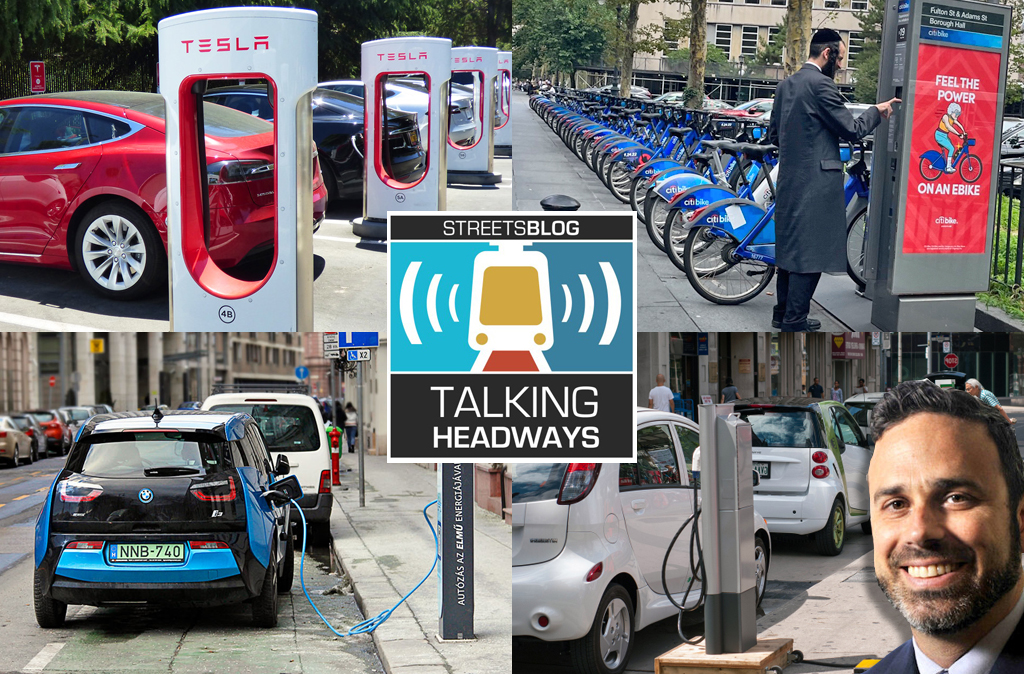
Talking Headways Podcast: Charging Up Transportation
This week, we talk to the great Gabe Klein, executive director of President Biden's Joint Office of Energy and Transportation (and a former Streetsblog board member), about curbside electrification.
Why Does the Vision Zero Movement Stop At the Edge of the Road?
U.S. car crash deaths are nearly 10 percent higher if you count collisions that happen just outside the right of way. So why don't off-road deaths get more air time among advocates?
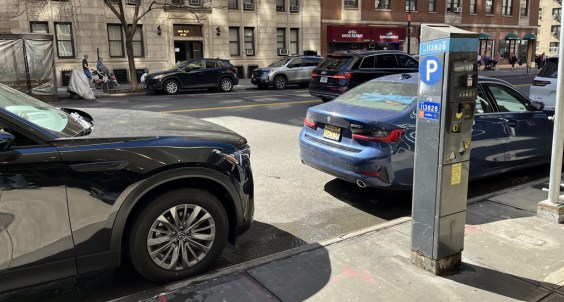
Donald Shoup: Here’s a Parking Policy That Works for the People
Free parking has a veneer of equality, but it is unfair. Here's a proposal from America's leading parking academic that could make it more equitable.
Thursday’s Headlines Turn Up the Heat
Whether you realize it or not, climate change is here, and not just in the form of natural disasters.

Calif. Legislators Tackle AV, School Zone Safety
Are AVs freight trucks ready to be deployed on California roads with no one in them?