How Much Driving Is Avoided When Someone Rides a Bike?
If Jane Doe rides her bike a mile to the post office and then back home, is it fair to assume she just avoided two miles of driving? And can we then assume that she prevented 2.2 pounds of carbon dioxide from being emitted?
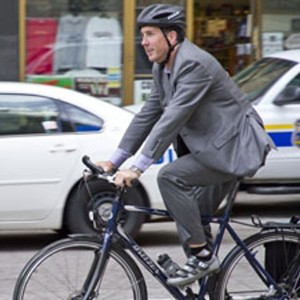
That’s more or less the way most agencies calculate averted vehicle-miles traveled. One mile biked is one mile not driven.
That simple assumption masks enormous complexity, however. And with at least 33 states and hundreds of cities, towns, and counties having instituted climate action plans or emissions reduction targets, we're going to need a better method of measuring the carbon that biking keeps out of the atmosphere.
It's not too hard to figure out the carbon savings from reduced VMT. But looking at it the other way around -- calculating the carbon-reduction benefits of increased biking -- can be a challenge.
If bicycling is on the rise in your city -- because of bike-share or better infrastructure, for example -- what does that mean for your city's carbon footprint? A mode shift metric that accurately captures this information could encourage municipalities to invest more in biking and walking as a carbon reduction strategy.
Not that biking always replaces driving. Some bicycle trips are primarily recreational and wouldn’t be made by any other mode. Or if someone shifts from bus commuting to bike commuting, then they're obviously not taking a car off the highway (though the newly available space on the bus might then be filled by someone making the switch from driving to transit). Ten million U.S. households don’t have access to a car, according to the Brookings Institution, and regular cyclists are probably over-represented in that number. Shouldn't it change the equation if a cyclists' backup mode is transit or walking?
But there are also reasons to think that the 1:1 ratio is actually undercounting vehicle miles averted, and therefore underestimating the power of mode shift.
Blunt Instruments Overlook the Nuances of Transportation and Land Use
The Federal Highway Administration acknowledges some complexity in this problem but its tools are still remarkably blunt. The agency borrowed the San Francisco Bay Area’s measure of how many car trips will be replaced with bike trips if a new bike facility is installed. The assumption is that 1.09 percent of car trips on a project corridor will shift to bike trips. That number is then simply multiplied by the average length of a bicycle trip to calculate VMT averted.
For its Nonmotorized Transportation Pilot Program, FHWA estimated the additional trips that were taken by foot or by bike as a result of improvements and multiplied that by the average length of a non-motorized trip, according to the National Household Travey Survey: 2.26 miles for a one-way bicycling trip and 0.7 miles for a one-way walking trip.
But FHWA also points out that there may not be a “one-to-one mileage trade-off between vehicle trips and nonmotorized trips; it is likely that vehicle trips are often longer than walking and bicycling trips, particularly for discretionary utilitarian trips (like shopping or dining out).”
FHWA’s guidance also notes that the reduction in miles driven could be longer than the actual bicycle or pedestrian trip if those trips are linked with transit. Strategic installation of biking and walking facilities near transit can have an enormous multiplier effect. But to measure it, you need to figure out how many people wouldn’t have taken transit without the walkway or bikeway and how many of them would have driven alone all the way to their destination instead.
A Los Angeles Metro survey indicated that 27 percent of people who linked bicycle and transit trips would have taken a car the whole way if there were no bicycle connection to the transit station. Metro didn’t distinguish between those who would drive alone, carpool, or get dropped off.
Sometimes Destination Follows Mode Choice, Not the Other Way Around
Models assume that a person decides on their destination and then picks their mode of travel. But sometimes the mode choice influences the destination.
If I’m on foot, I’m often going to go to the organic grocery store four blocks away, but it’s expensive. If I have access to a car, I might decide to go to a supermarket that's farther away, but cheaper, and stock up on essentials.
Different trip patterns on different modes can complicate the attempt to quantify how much driving is avoided when someone bikes. Studies have shown that cyclists, on average, make more shopping trips than drivers, probably because they buy only what they can carry home. Portland State University researchers found that people who drove visited a convenience story an average of 9.9 times per month, while biking customers visited the same store 14.5 times a month.
Land use and social preferences are also key factors. There are community characteristics that won't change with the installation of a new sidewalk or bike lane.
“You can take a suburban community and put in better bike facilities, and let’s add some closer destinations -- infill stuff, so people have stores nearby – but you’re dealing with the population who still lives there,” said Robert Schneider, professor of urban planning at the University of Wisconsin-Milwaukee. “And those people moved there because they have certain preferences and might not realize the new opportunities that are there.”
All of these factors would make for some complicated modeling, to be sure. But it's not impossible.
How the Experts Do It
Brian Gregor is a transportation analyst at Oregon DOT. He was instrumental in developing GreenSTEP, a tool that lets ODOT estimate and forecast the effects of various policies on the amount of vehicle travel, the types of vehicles and fuels used, energy consumption, and the resulting GHG emissions. GreenSTEP was used as a model for FHWA's Energy and Emissions Reduction Policy Analysis Tool (EERPAT).
"You've got to have a certain amount of simplification," he told Streetsblog. But for GreenSTEP, Gregor didn't shy away from complexity. "You've got the vehicles and their different power trains," he told me, "the different vehicle mixes; you've got the fuels, and then you've got the myriad of things that affect VMT, which include transit service levels and prices, and all the characteristics of the household, and interactions between those factors."
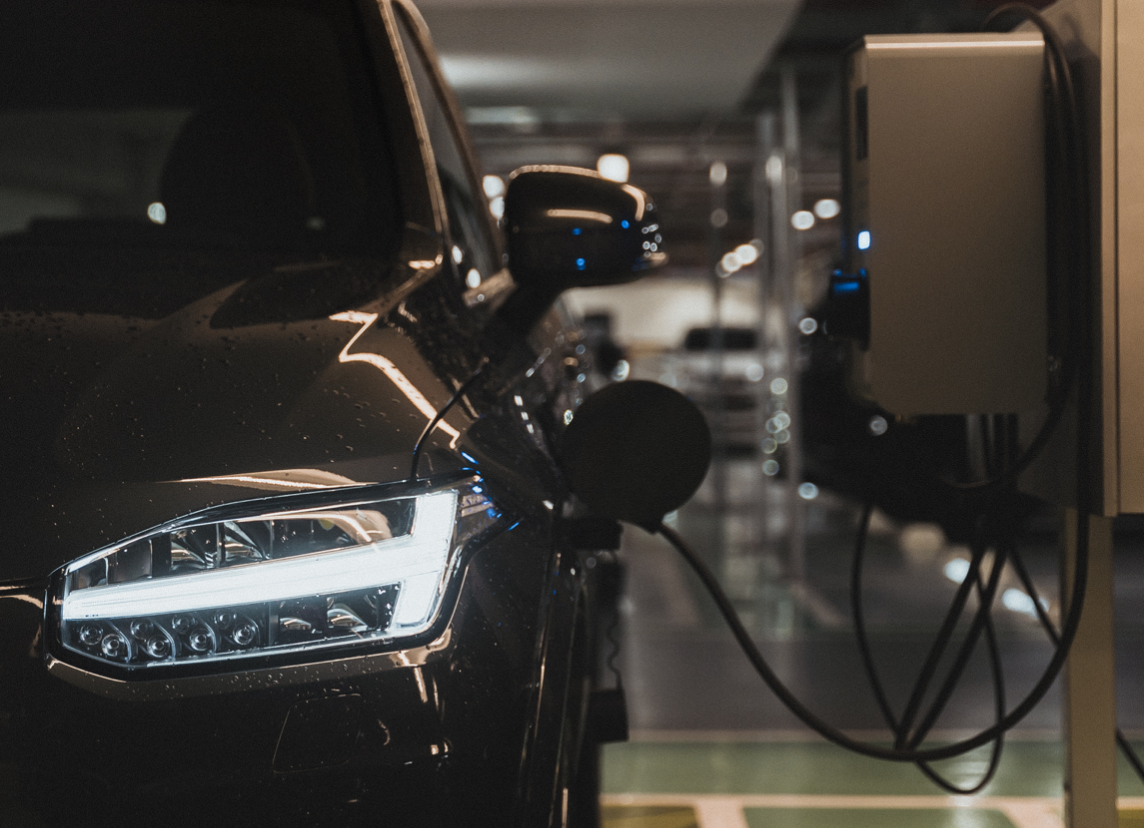
To measure carbon emissions averted, Gregor doesn't just use fuel economy averages. He looks at schedules of average fleet MPG by model year, all the way out to the year Oregon's greenhouse gas emission goals are aiming toward, accounting for the full variety of vehicle body type and power train. Also in the mix is each fuel, including electricity, with its particular carbon intensity.
His team also factors in, at the household level, the number of people of different ages, their incomes, the land use type (urban or rural), the density of neighborhood, whether it's a mixed-use neighborhood, the existence of transit service, and other factors -- and from there, they determine the household's likelihood of owning a vehicle, how many vehicles, the likely ages of vehicles, and their likely VMT.
That's how they estimate carbon emissions -- first at the household level and then at the state level. Could they have just multiplied the number of cars registered in the state by average VMT by average fuel economy by pounds of CO2 per gallon? Sure. But they wouldn't have gotten very good data. Is it so preposterous to think someone might use this degree of precision to understand the carbon-reducing power of non-motorized transportation?
Gregor says he's never tried to deduce miles not driven or carbon emissions avoided from biking and walking numbers. But he says it could be done. "That’s where urban travel demand modeling is moving," he said. "These things are getting more sophisticated."
Stay in touch
Sign up for our free newsletter
More from Streetsblog USA
Friday’s Headlines Got Served
Another day, another GOP lawsuit trying to overturn a Biden administration climate change rule.
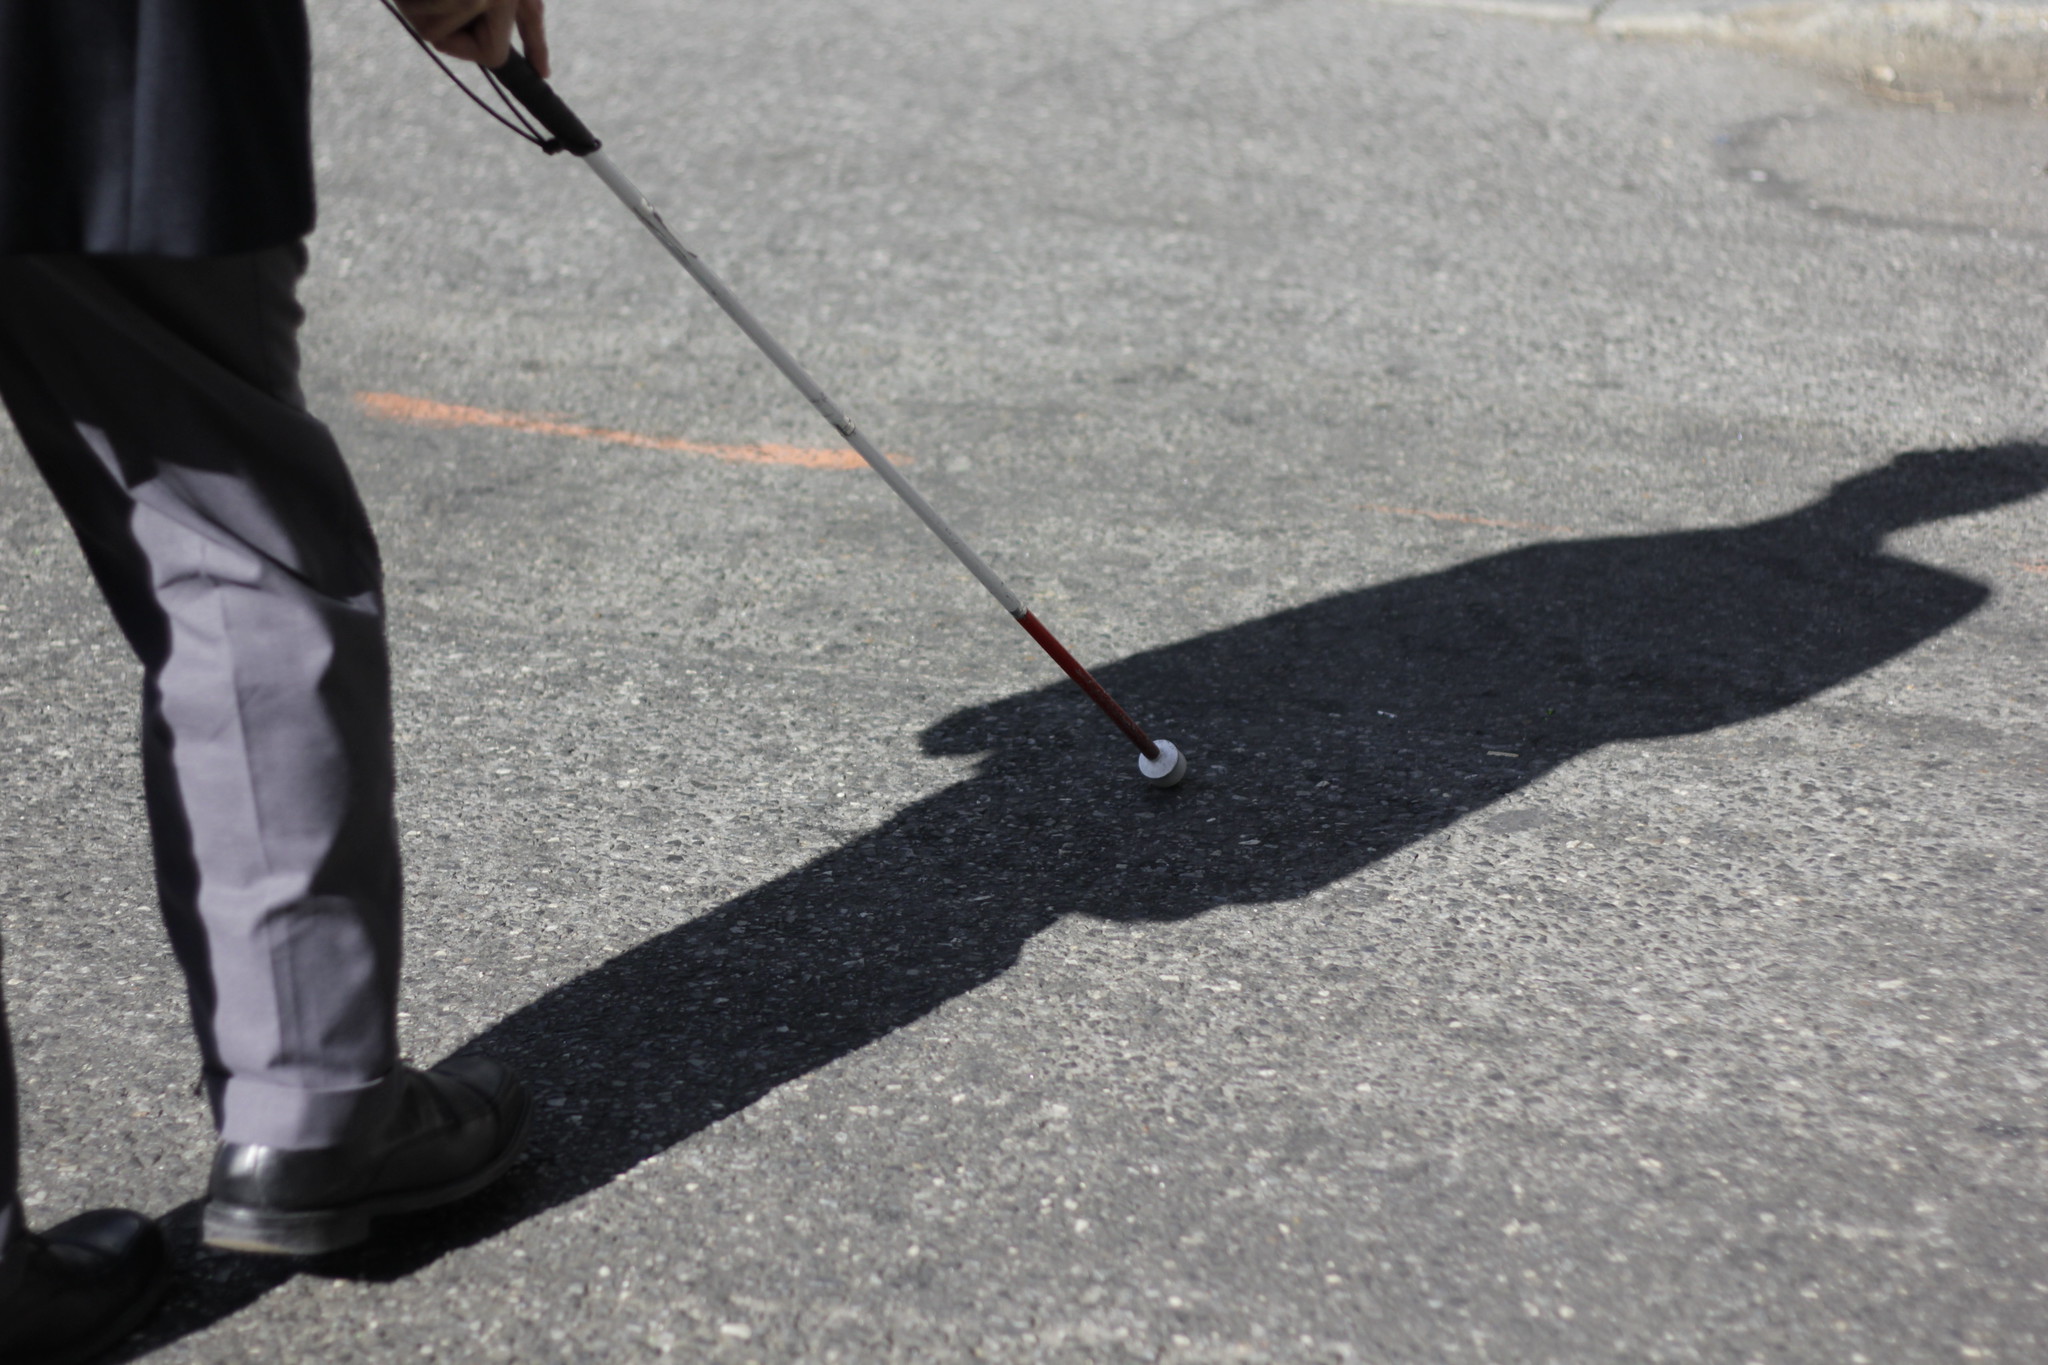
Disabled People Are Dying in America’s Crosswalks — But We’re Not Counting Them
The data on traffic fatalities and injuries doesn’t account for their needs or even count them. Better data would enable better solutions.
LA: Automated Enforcement Coming Soon to a Bus Lane Near You
Metro is already installing on-bus cameras. Soon comes testing, outreach, then warning tickets. Wilshire/5th/6th and La Brea will be the first bus routes in the bus lane enforcement program.

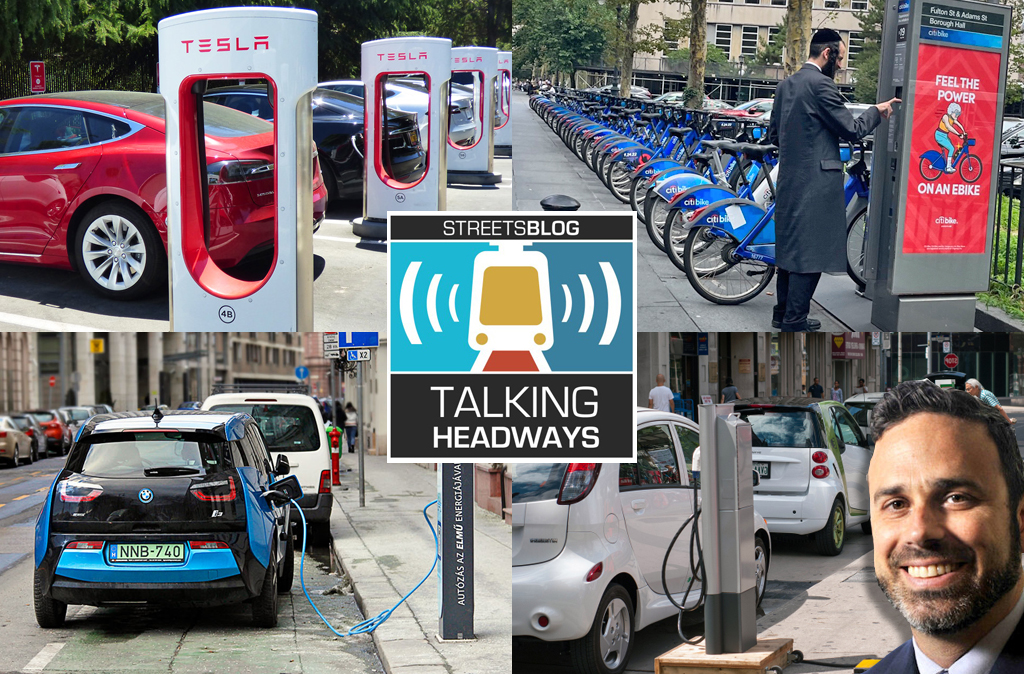
Talking Headways Podcast: Charging Up Transportation
This week, we talk to the great Gabe Klein, executive director of President Biden's Joint Office of Energy and Transportation (and a former Streetsblog board member), about curbside electrification.
Why Does the Vision Zero Movement Stop At the Edge of the Road?
U.S. car crash deaths are nearly 10 percent higher if you count collisions that happen just outside the right of way. So why don't off-road deaths get more air time among advocates?