Why Traffic Deaths Are More Common in Red States Than in Blue States

Public interest journalist Stuart Silverstein at FairWarning.org has uncovered the fact that red states (defined as those that went for Mitt Romney in the last election) have higher traffic fatality rates than blue states (those that went for Barack Obama). The correlation is striking, Silverstein says, but he's at a loss to explain it:
The 10 states with the highest fatality rates all were red, while all but one of the 10 lowest-fatality states were blue. What’s more, the place with the nation’s lowest fatality rate, while not a state, was the very blue District of Columbia.
Massachusetts was lowest among the states, with 4.79 road deaths per 100,000 people. By contrast, red Wyoming had a fatality rate of 27.46 per 100,000.
The numbers are based on 2010 fatality statistics from the NHTSA.
Silverstein asked a few sources to weigh in -- including Thomas Frank, author of “What’s the Matter With Kansas? How Conservatives Won the Heart of America,” and former federal auto safety researcher Louis V. Lombardo -- but they couldn't quite put their finger on what's going on.
“It may be something we don’t have a definitive answer for,” Lombardo said.
“This is someplace where you would not expect to see a partisan divide,” Frank said.
I'm not nearly as smart as either of these guys, but I couldn't help noticing that there are different travel patterns in the (mostly rural) red states and the (more urban) blue states. Perhaps that has something to do with it.

The fact that DC is the "state" with the lowest rate of fatalities is telling. DC is the only place on the list that's entirely urban, indicating that city living lowers the chance that a person will die in a car. It's also where Barack Obama racked up the highest percentage of the vote.
FairWarning's ranking of fatalities is a stark reminder of University of Virginia Professor William Lucy's findings that moving out of the city to a "safer" suburb can actually expose you to greater dangers.
People drive faster on high-speed suburban arterials than on skinny city streets with lots of stop signs. But more importantly, people simply don't drive as much in cities. They take the bus; they ride their bikes; they walk; they commute by light rail, metro, or commuter rail -- in short, city dwellers have transportation options, so not everyone drives. And the less people drive, the fewer people die in traffic.
Silverstein questions his own statistics, which show fatalities per capita and not per mile of driving, but he shouldn't. Basing crash statistics on vehicle miles traveled ends up making heavy-driving states look safer. In the end, the more important question is: Where is it safer to live?
This ranking of traffic fatalities correlates rather neatly with NRDC's list of states with the best policies for reducing oil dependence, which we featured yesterday. The states doing the most to provide more transportation options and encourage compact development almost read like an Obama fundraising itinerary: California, Oregon, Washington, Massachusetts, New York, Connecticut, Maine, Maryland, Rhode Island, and Vermont.
There are other factors Silverstein mentions, which likely play some role: state safety laws, access to top-level trauma centers, weather conditions, income and education levels. But the basic truth is that cities are safer. People who live in urban areas drive less, they drive slower, and they travel by other, safer, modes.
So, you can vote Republican and still improve your chances of surviving all your daily trips. You just have to live in an urban place.
Stay in touch
Sign up for our free newsletter
More from Streetsblog USA
Thursday’s Headlines Don’t Like Riding on the Passenger Side
Can you take me to the store, and then the bank? I've got five dollars you can put in the tank.
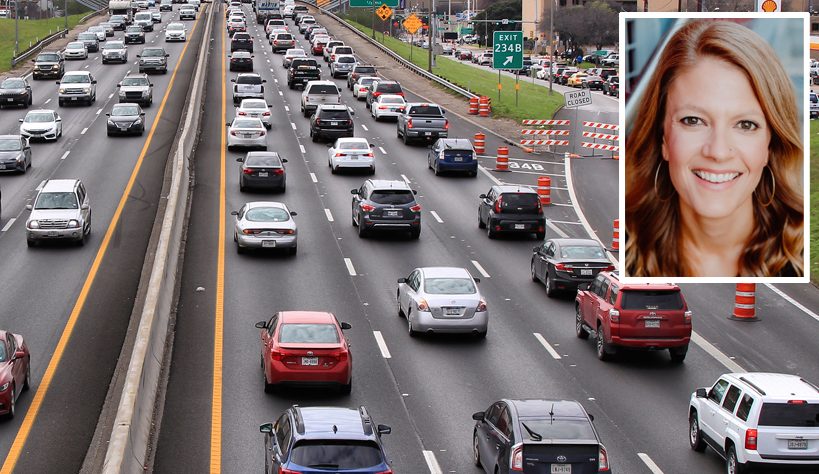
Study: When Speed Limits Rise on Interstates, So Do Crash Hot Spots on Nearby Roads
Rising interstate speeds don't just make roads deadlier for people who drive on them — and local decision makers need to be prepared.
‘We Don’t Need These Highways’: Author Megan Kimble on Texas’ Ongoing Freeway Fights
...and what they have to teach other communities across America.
Should Wednesday’s Headlines 86 SUVs?
American tax law encourages people to buy the gas-guzzling and deadly vehicles, but some in Canada are pushing to ban them.

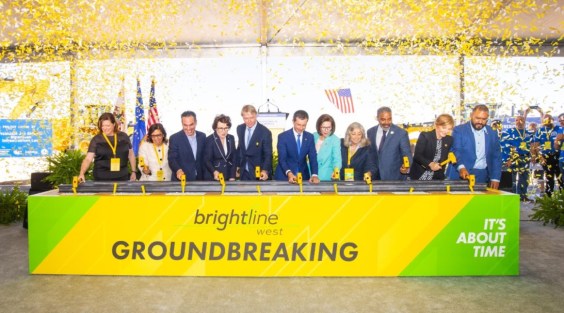
Brightline West Breaks Ground on Vegas to SoCal High-Speed Rail
Brightline West will be a 218-mile 186-mile-per-hour rail line from Vegas to Rancho Cucamonga — about 40 miles east of downtown L.A. — expected to open in 2028.