Update: Komanoff and Streetsblog learned in January, 2021, that the data source for this post, Carbon Monitor, employed a questionable methodology to estimate the downturn in U.S. tailpipe emissions. Prodded by Komanoff, CM revised its approach when it published full-year CO2 data in February. The new data indicate a much lesser (9% rather than 24%) decline in U.S. tailpipe emissions in 2020 vs. 2019. For a fuller account, see Komanoff's Carbon Tax Center post, Data Correction Reveals 2020 CO2 Shrinkage Was Less Than Reported.
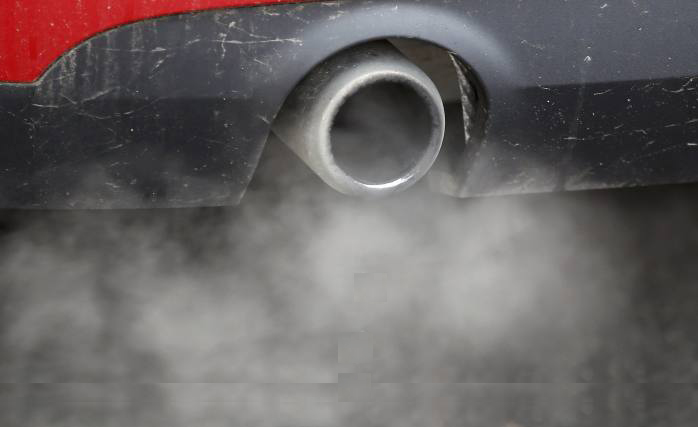
U.S. cars and trucks, the source of 5 percent of world carbon emissions, have accounted for a whopping 20 percent of this year’s global dip in carbon pollution, according to comprehensive emissions data compiled by Carbon Monitor and recalculated by me for the Carbon Tax Center.
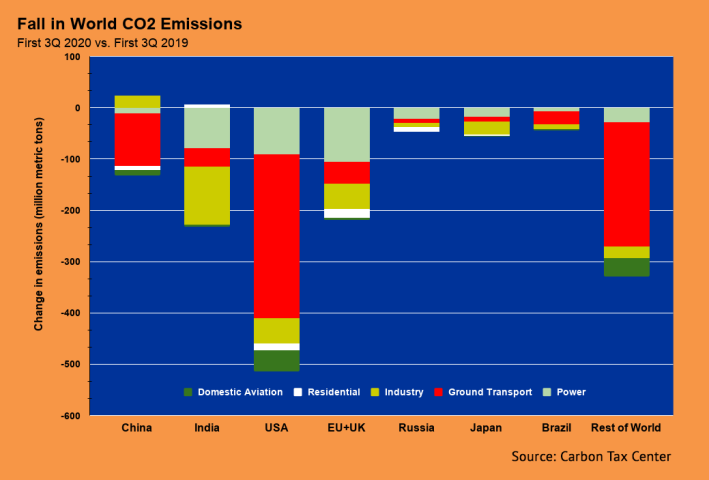
During the first three quarters of 2020, a period that roughly coincides with lockdowns and other restrictions from the COVID-19 pandemic, the world's emissions of carbon dioxide from burning fossil fuels fell by more than 1.6 billion metric tons from the same period in 2019, a decline of 6.3 percent. Fully one-fifth of the decline, 320 million tons, was due to the nearly 25 percent drop in U.S. ground transport emissions. (A metric ton, roughly 1.1 short tons, is the standard metric for carbon emissions.)
Nearly half of the global CO2 decline — 787 million tons out of the overall 1,621-million-ton drop — was accounted for by reduced ground transport emissions, even though, pre-pandemic, car and truck traffic accounted for just 19 percent of total CO2. (Carbon Monitor’s other emission categories are power generation, industry, residential and aviation.)
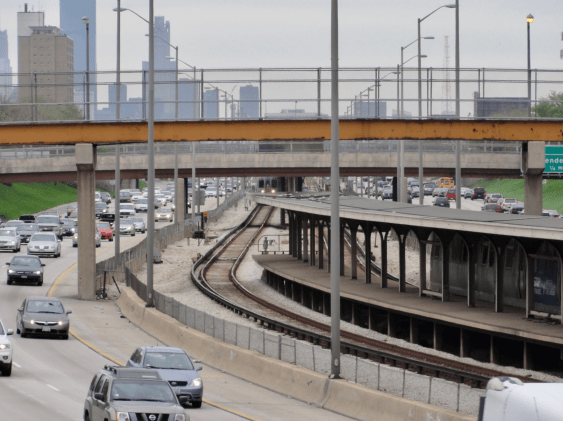
With truck use probably little affected by the pandemic, as indicated by the mere 3 percent drop in world carbon emissions from industry (8 percent in the U.S.), the decline in ground transport emissions presumably is attributable to decreased use of passenger vehicles. The sheer size of the U.S. emissions drop, 24.5 percent, suggests that not just work commuting but the much larger discretionary or recreational driving sector — day-tripping, shopping, vacations, social and sports events, etc. — has taken huge hits.
Europe, denoted here as EU-27 & UK, presents an interesting comparison with the United States. Ground transport emissions fell less sharply in Europe than in the U.S., yet other emitting sectors contracted more in Europe than here. This too points to ample “slack” in U.S. auto use that could be reduced through policies aimed at cutting car-dependence.
In both absolute and percentage terms, the total U.S. year-on-year January-September decline — 514 million metric tons and 13.1 percent — outpaced the world's other major emitting nations and regions. Close behind the United States in percentage terms of decline were Brazil, with a 12.9-percent drop from 2019 to 2020, and India with 11.7 percent. But because U.S. emissions are so large in absolute terms, the tonnage drop here dwarfed that of India (225 million tons) and Brazil (44 million tons).
China was far down the ranks of emission reducers. From the first three quarters of 2019 to the same period in 2020, its emissions shrank by just 109 million tons, a decline of only 1.4 percent. Although China's ground transport carbon emissions did fall by 15 percent, none of the country's other major emitting sectors showed pronounced declines, except for domestic aviation, which fell by 26 percent. Omitting China from the calculations, world CO2 emissions fell by 8.4 percent over the three-quarter periods, though admittedly that construct is a bit like considering recent U.S. presidential popular votes without California.
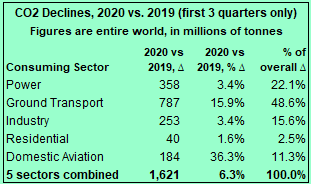
The reduction in global aviation emissions, 36 percent, was the most pronounced of any sector, as many air travelers deemed it unwise to spend hours in confined aircraft spaces, and teleconferencing filled in for most business travel. The reduction rate might have been higher still, but for "ghost flights" resulting from Byzantine government regulations and financial incentives.
There's something satisfying in seeing year-on-year carbon emission figures in negative-land, even as we can't deny the enormous human and social suffering that in some ways delivered the reductions. A global pandemic causing over 1.3 million deaths and rising, according to the count maintained by Johns Hopkins University, and stunting child development as "remote learning" replaces in-person schooling, to name but one societal forfeiture, is not the path anyone would choose to curb climate-wrecking use of fossil fuels.
This post only skates the surface of the data made available by Carbon Monitor. Their downloadable Excel file comprises some 36,000 entries: CO2 emissions for every 2019 and 2020 day (Jan.-Sept.) for five categories by eight countries or regions (some rows capture individual European countries: France, Germany, Italy, Spain and the UK). The daily data provide a quantitative window into that terrifying but bracing springtime period when lockdowns pushed emission rates in the US and other countries 20 or even 40 percent below year-earlier levels. The Carbon Monitor graphics (same link as above) are marvelous as well.
Read More:
Stay in touch
Sign up for our free newsletter
More from Streetsblog USA
Thursday’s Headlines Turn Up the Heat
Whether you realize it or not, climate change is here, and not just in the form of natural disasters.

Wednesday’s Headlines Are Running on Empty
Fewer commutes to downtown offices means less money to fund transit services, even as money for autocentric infrastructure keeps right on flowing.
What to Say When Someone Claims ‘No One Bikes or Walks in Bad Weather’
Yes, sustainable modes are more vulnerable to bad weather. But that's why we should invest more in them — not less.

Chicago Announces $2M Federal Grant to Address Harms Caused By I-290
The Mayor's Office says the money will fund "improvements for people walking and bicycling on existing streets and paths surrounding and crossing the corridor."
Car Crashes by City Workers Cost NYC Taxpayers $180M in Payouts Last Year: Report
A record number of victims of crashes involving city employees in city-owned cars filed claims in fiscal year 2023 — and settlements with victims have jumped 23 percent, a new report shows.