Study: How Can We Know If Quarantine Street Closures Worked?
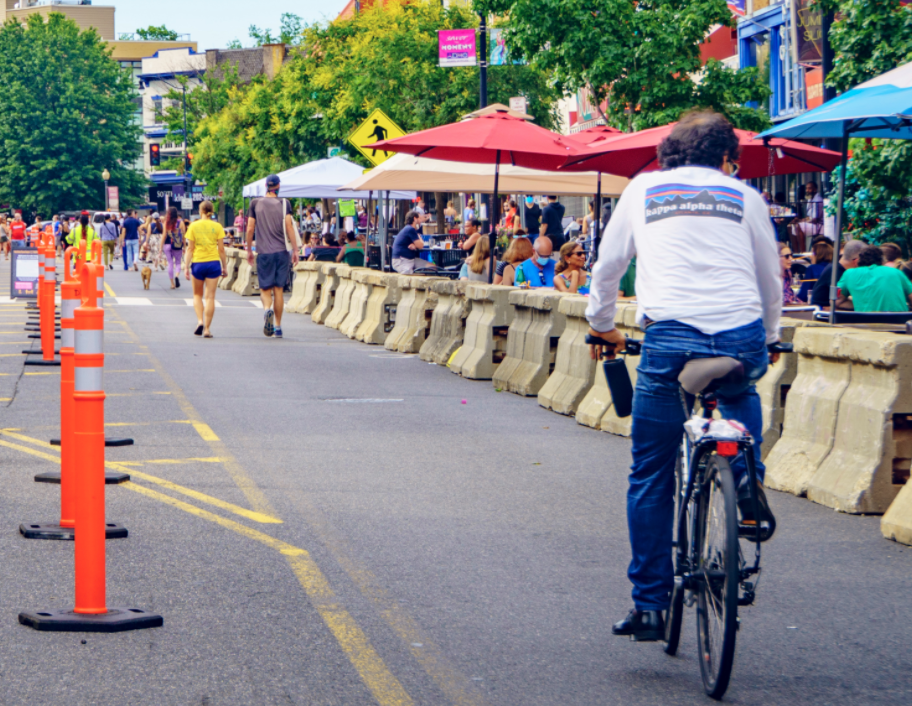
An Open Streets event in Washington, DC. Source: Ted Eytan via Creative Commons.
"Slow streets" and "open streets" programs that were launched in response to COVID-19 were bigger successes than anyone realized — but some cities didn't look at the metrics before they shut down popular programs, a new study reveals.
Using anonymized cell phone data from pedestrians and cyclists overlaid with census demographics, the traffic analytics firm INRIX analyzed the efforts of five cities to give non-drivers more space to socially distance by restricting or banning motor vehicle access along a handful of carefully chosen routes. No overall conclusion can be drawn because the programs were diverse in their goals: Minneapolis and Seattle, for instance, designed their "Healthy Streets" programs around giving residents space to recreate outside of crowded neighborhood parks, while others, like the "Open Restaurants" initiative in New York City, emphasized letting restaurant owners owners set up patio tables in what were previously parking spots or driving lanes.
But all of them shared at least one difficult-to-quantify goal: decreasing the spread of COVID-19 by giving people safe, people-centered spaces to live their lives and meet their basic needs without the threat of being hit by a car.
It's impossible to measure how many people were saved from COVID-19 specifically because cities gave crucial road space to residents, rather than forcing them to rely on crowded sidewalks or packed parks when they needed to leave the house. And during a pandemic, the simplest conventional measure of a successful "Healthy Streets" event — high turnout — is exactly the wrong metric to analyze.
But it is possible to know who made use of these programs most — and who wasn't well-served by the specific emphasis of each city's event.
"There aren’t any hard-and-fast criteria out there for a successful [street closure or car-limiting] program, or for an unsuccessful program — at least during a pandemic," said Bob Pishue, the author of the study. "But we can ask some data-driven questions about utilization: Does a program activate the neighborhood around it? Are people coming from outside the neighborhood to use it? What does it do for businesses in the area? When does the design of the space impact our desired usage negatively?"
Who showed up to Slow Streets — and who didn't
INRIX looked at a variety of variables to help give cities a sense of the real impact of their street closures programs — and show them a few easily-measurable goals they might set for future street closure programs, even after there's a vaccine.
To conduct their analysis, the researchers first identified a "control" street in each city with comparable styles of "utilization, location, functional classification and direction" as the route that was selected for a "slow" or "open" streets treatment. (Translation: if a city did an Open Restaurants pop-up in a bustling, walkable restaurant district in the downtown core, the researchers compared that street's pedestrian activity with another restaurant row in town that didn't get an intervention — rather than comparing it to pedestrian activity in the city overall.) Then they analyzed each street's percentage of one-time visitors versus repeat visitors who were more likely to live in the area — a good, rough shorthand for whether a street closure event was a mainstay for the surrounding neighborhood, or a destination for visitors.
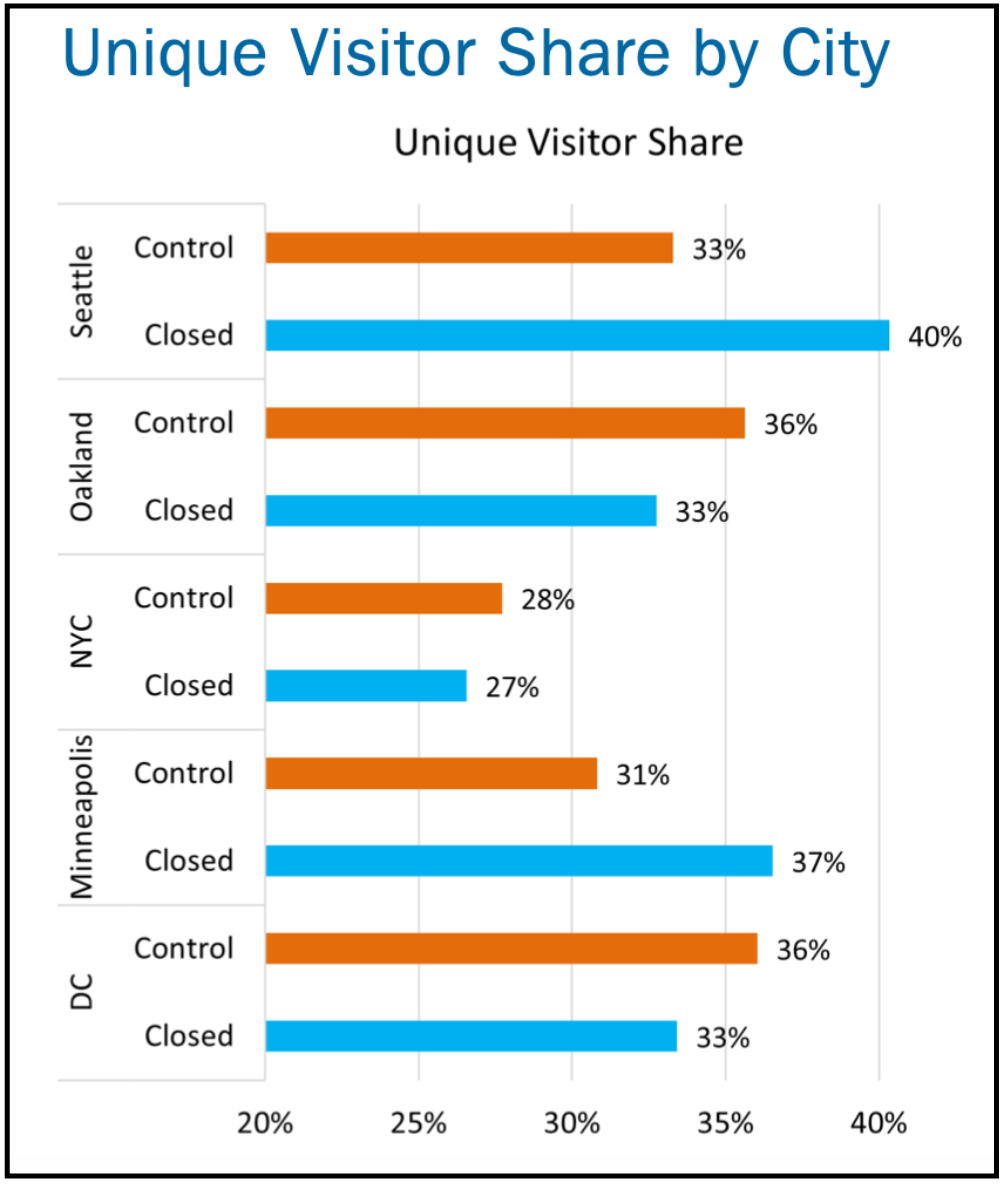
New York City, which deployed several types of Slow Streets interventions across the city, had fewer repeat visitors overall than on the control streets, though the researchers noted that "full block" programs focused on recreation outperformed both "open restaurants" streets for dining and pop-up protected bike lanes. The researchers speculated that "by eliminating and restricting parking and thru-traffic, cities [like New York] may be discouraging those from outer neighborhoods frequenting restaurant districts and other street-based activities" – but in transit-rich New York City, we're willing to bet it has a little more to do with the fact that the region still has some of the highest COVID-19 death rates in the nation, and many Big Apple residents are still wary of venturing into other neighborhoods to catch a bite outdoors or commute to still-shuttered offices (though, crucially, they do still make use of space to recreate on slow streets near their homes.)
Seattle, meanwhile, had the highest proportion of unique visitors to its "Stay Healthy Streets" program , which is probably a sign of that program's success. The Emerald City's initiative was much less broad than New York's – it primarily focused on closing the roads adjacent to popular parks to reduce crowding — so a high number of distinct visitors may be a sign that the city did a good job of serving broad cross-section of Seattleites at key attractions, while still giving everyone lots of room to breathe.
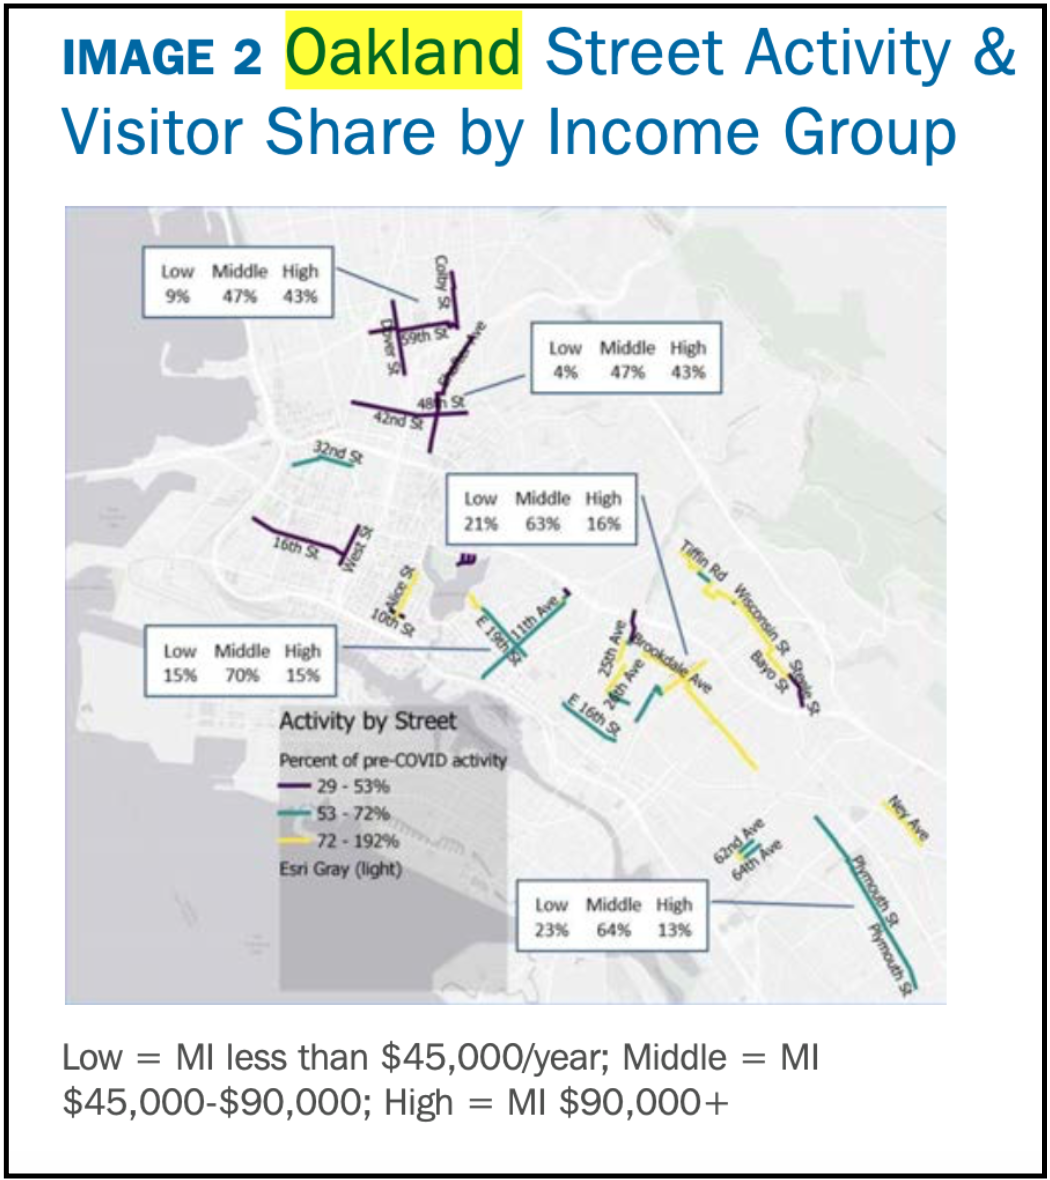
Oakland's extensive Slow Streets program, by contrast, was all about giving residents a place to get out and stay socially distanced close to their homes — in which case a lower share of unique visitors from all over the city is probably a good thing. And when the researchers dug into which of the many Slow Streets saw the highest number of people taking advantage of the newly car-light spaces just beyond their doorsteps, they found that residents of low-income neighborhoods were more likely to show up.
On the bright side of the Bay, neighborhoods with activity rates at least 72 percent of pre-pandemic levels were located in areas where at least 21 percent of Slow Streets visitors had incomes under $45,000 a year. Higher-income neighborhoods, by contrast, had fewer attendees overall — suggesting that richer East Bay residents may have been more likely to recreate in their private backyards or on the Peloton indoors, rather than out in the roadway with their neighbors.
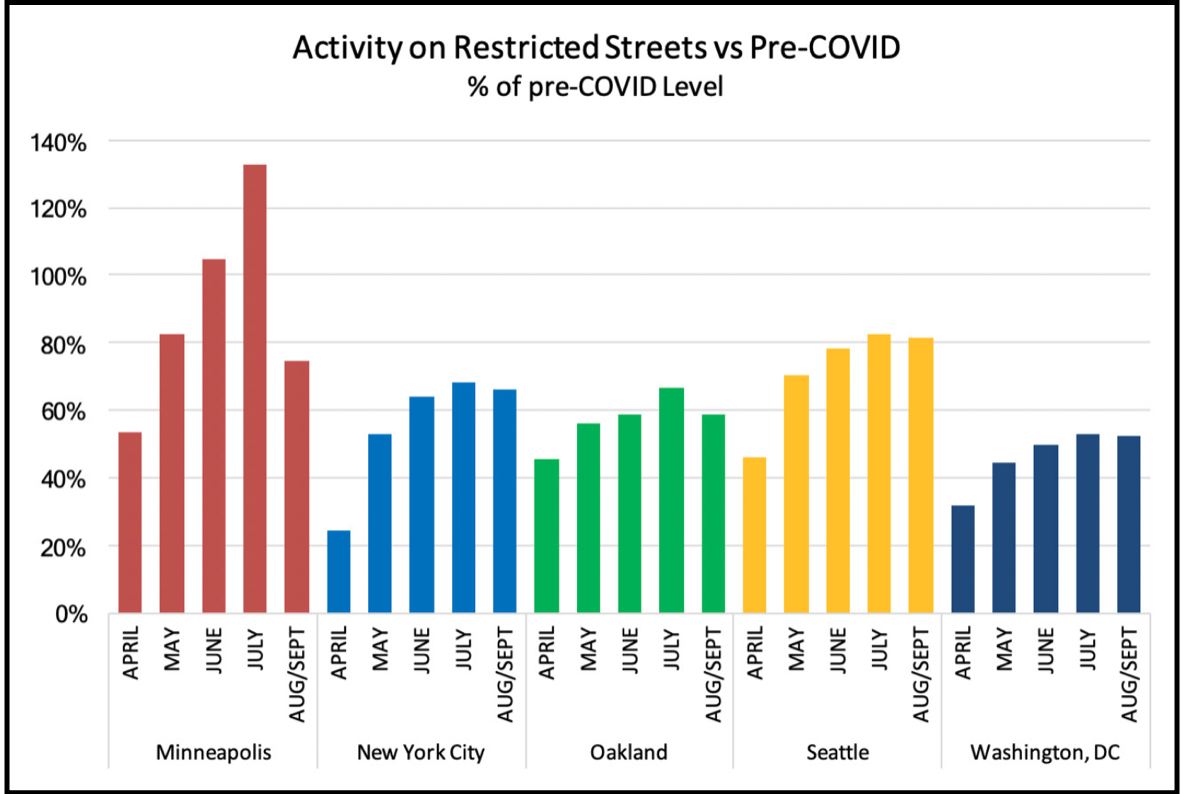
Interestingly, some of the most objectively successful programs didn't last. Minneapolis's version, Stay Healthy Streets, which banned driver through-traffic on exercise-focused loop routes in three major neighborhoods across town, actually outpaced the number of unique, non-driving road users compared to before COVID-19 by as much as 33 percent during the summer months. But when activity fell off in September, the city shut the program down.
"It was hard for me to understand why Minneapolis closed down when the whole goal was recreation and to get people out, and they were doing that," said Pishue.
The simplest explanation may be that Minneapolis' event simply got too popular in June and July, and the crowds might have scared off visitors come fall. That could help explain the August and September drop-off, along with the return of virtual learning for Minneapolis public school kids that kept many families indoors. Either way, the local government would probably have been wise to consider expanding the Stay Healthy program when demand surged, and perhaps re-engineering the program to meet the needs of an older population once families stopped frequenting the routes – rather than scrapping the event altogether.
The graph below, it should be noted, measures total activity on the restricted streets — which includes, in the case of Minneapolis, limited driver traffic. So it's possible that part of that June and July spike was attributable to increased driving activity — activity that could have driven pedestrians and cyclists away. INRIX did not specify the respective mode share of the data presented below.
But even data expert Pishue notes that quantitative metrics aren't everything — and even Open Streets events that didn't go exactly as planned may still be worth extending.
"There are real barriers to that is quantitative analysis, but it’s important to remember that it's the third leg in a three-legged stool," Pishue said. "The first leg is community support, which a lot of these programs have; the second is straight-up road safety statistics."
It bears repeating that every Open or Slow Streets program that's been launched during the era of COVID-19 was a success in one crucial way: it protected people from traffic violence. And no matter which metrics cities use to measure their progress the next time they haul out the sawhorses, they should mark that as a win.
Read More:
Stay in touch
Sign up for our free newsletter
More from Streetsblog USA
Friday’s Headlines Got Served
Another day, another GOP lawsuit trying to overturn a Biden administration climate change rule.
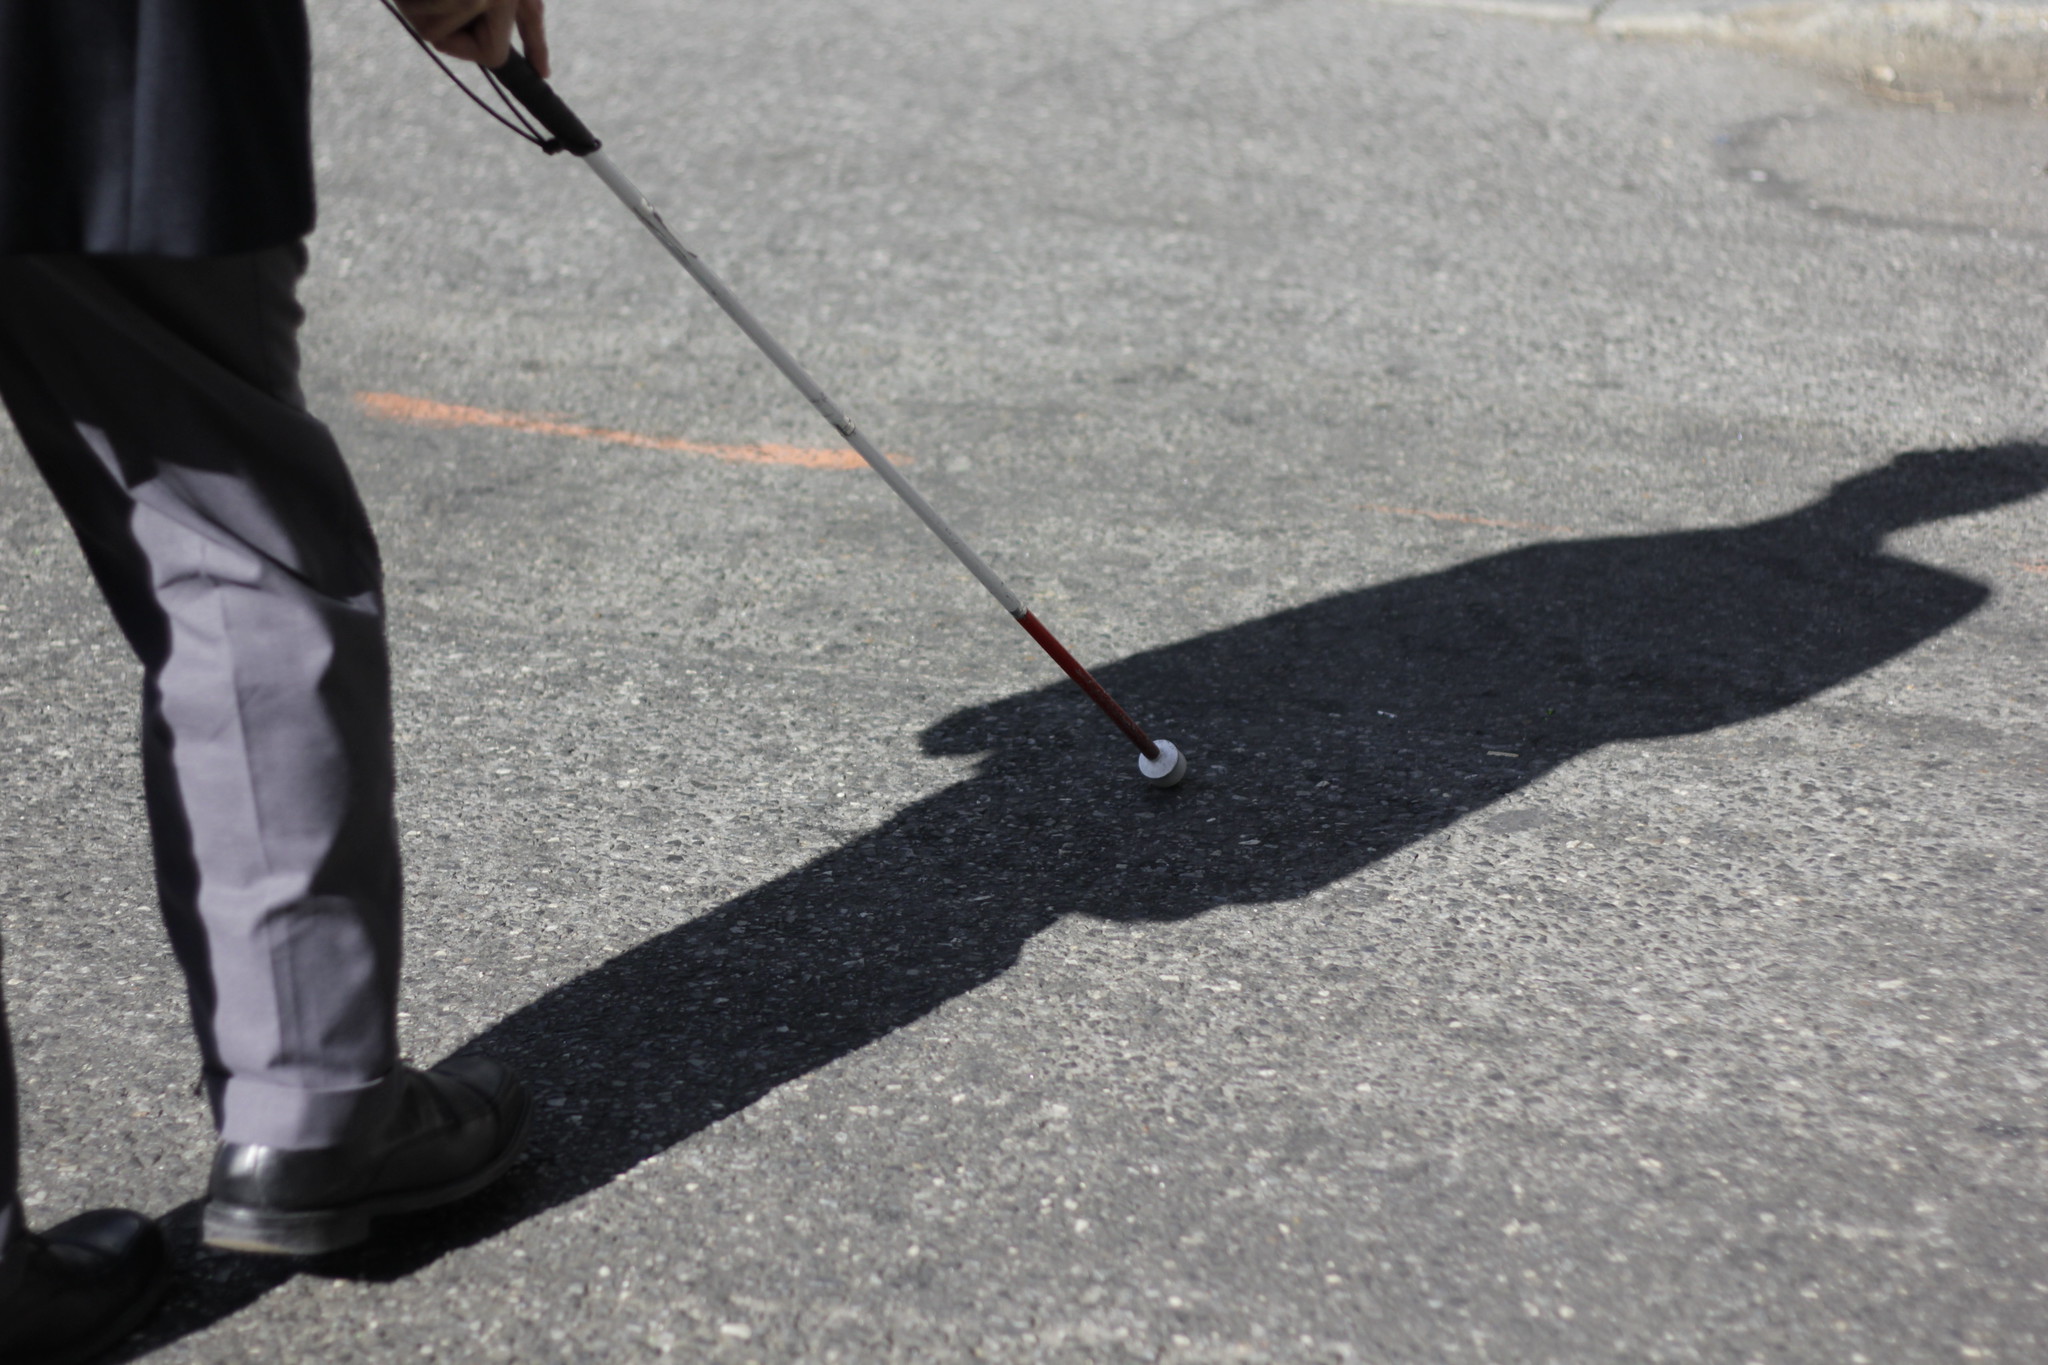
Disabled People Are Dying in America’s Crosswalks — But We’re Not Counting Them
The data on traffic fatalities and injuries doesn’t account for their needs or even count them. Better data would enable better solutions.
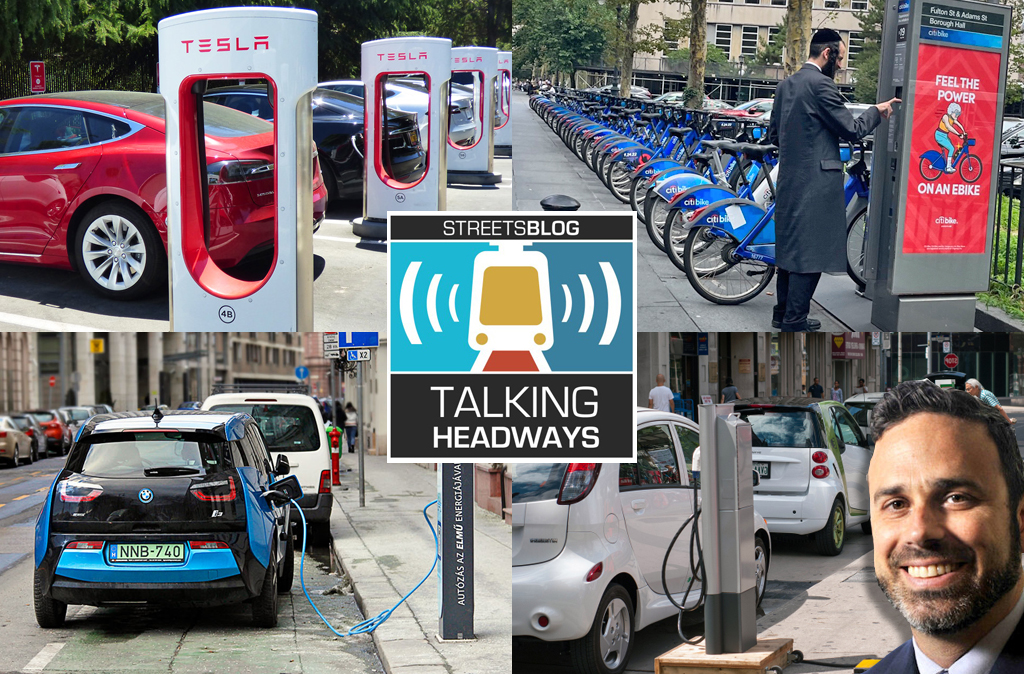
Talking Headways Podcast: Charging Up Transportation
This week, we talk to the great Gabe Klein, executive director of President Biden's Joint Office of Energy and Transportation (and a former Streetsblog board member), about curbside electrification.
Why Does the Vision Zero Movement Stop At the Edge of the Road?
U.S. car crash deaths are nearly 10 percent higher if you count collisions that happen just outside the right of way. So why don't off-road deaths get more air time among advocates?
Donald Shoup: Here’s a Parking Policy That Works for the People
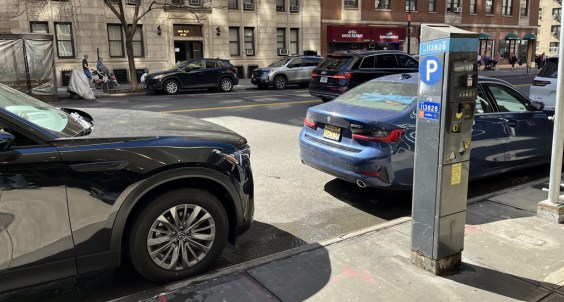
Free parking has a veneer of equality, but it is unfair. Here's a proposal from America's leading parking academic that could make it more equitable.